Figures & data
Figure 1. In vitro cell viability plots of cell control, oxaliplatin, HNP, and immuno-nanoparticles at different time intervals (A) 24 h (B) 48 h (C) 72 h on HT-29 colorectal cancer cell lines.
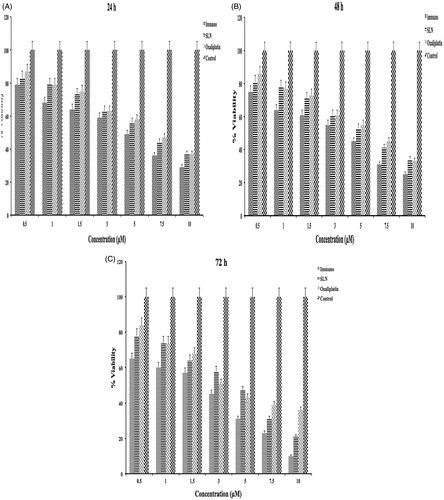
Figure 2. Morphological nuclear staining by DAPI for nanoparticulate formulations comparable to control and oxaliplatin.
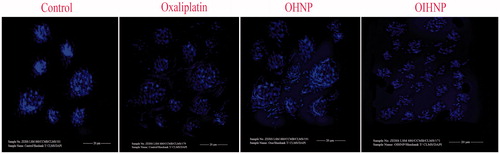
Figure 3. Quantitative assessment of apoptotic ratio of cell control, oxaliplatin, OHNPs, and OIHNPs by annexin V-FITC/PI staining at 72 h. Viable cells were conformed with 91.2% of the cells in the LL quadrant.
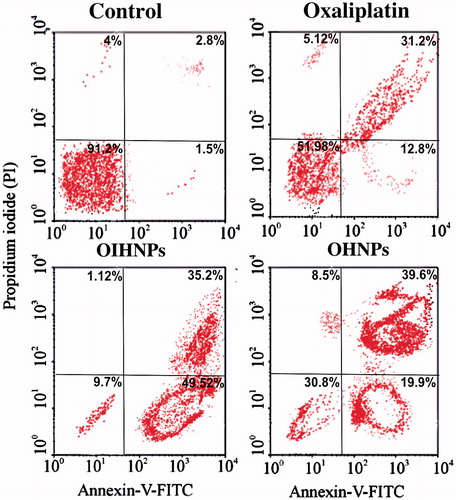
Figure 4. Fluorescent microscopic images of HT-29 colon cancer lines with immunonanoparticles, OHNPs, and pure drug (oxaliplatin) at 24 h and 72 h. Control was visualized by green fluorescence at all time intervals conforming its viability. Oxaliplatin had shown minimal fluorescence of light orange and green representing minimal apoptosis. OIHNPs had shown appreciable apoptosis attributing to the major part of the cells with red fluorescence.
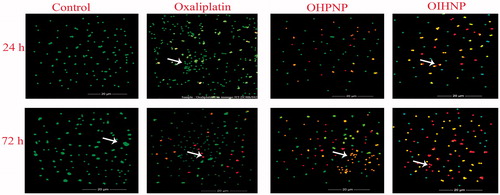
Figure 5. Cell-cycle analysis of HT-29 cells after 72 h of treatment with oxaliplatin, TRAIL, OHNPs, and OIHNPs. Nanoparticles had shown transition S-phase delay with cell-cycle arrest at G2 phase.
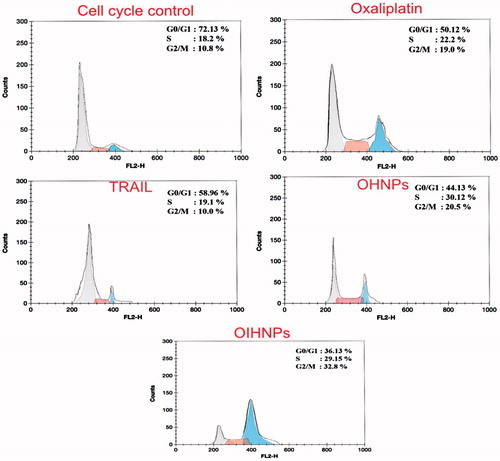
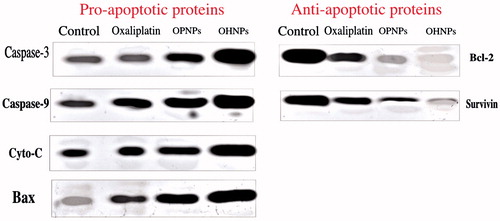
Figure 6. Caspase-mediated apoptosis induced by oxaliplatin hybrid nanoparticles in comparison with oxaliplatin-treated HT-29 cells confirmed by western blot analysis of pro-apoptotic and antiapoptotic proteins.