Figures & data
Table 1. Independent and dependent variables in Box–Behnken design
Table 2. Composition of the suggested NPs formulations according to BBD
Figure 1. Schematic presentation for the preparation of NPs by the emulsion–solvent evaporation method.
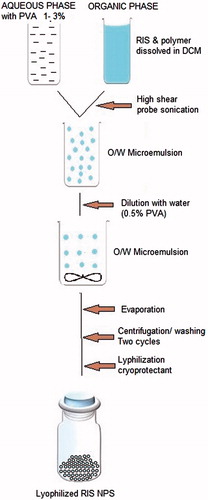
Table 3. Estimated effects of the studied factors and associated P values for the obtained responses (Y1–Y3)
Figure 2. Standardized Pareto charts for Y1, Y2, and Y3.
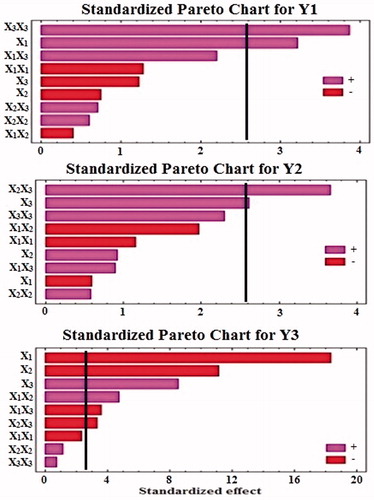
Figure 3. 3D-response surface plots showing the effect of X1, X2, and X3 on the responsesY1, Y2, and Y3.
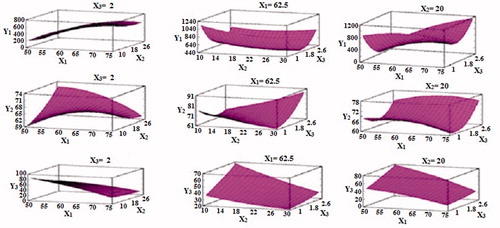
Table 4. Correlation coefficient (r) of different kinetic models and drug release mechanism (n), of RIS NPs formulations prepared according to Box Behnken design
Figure 4. SEM image of optimized RIS NPs formula.
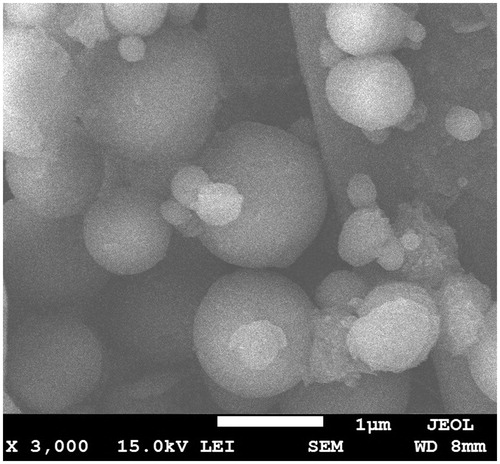
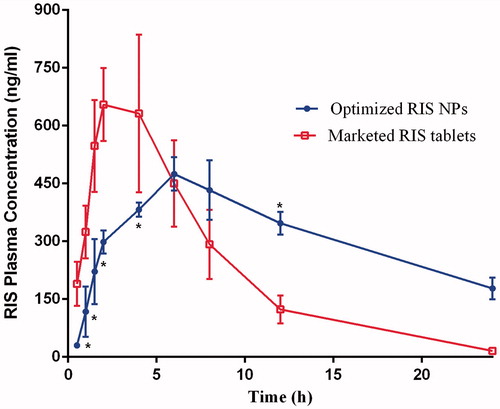
Figure 5. Mean plasma concentration-time profile of RIS after oral administration of single dose (0.3 mg/kg) of the marketed risperidon tablet and optimized RIS NPs, each point represents the mean of n = 6 ± SD.