Figures & data
Figure 1. 1H-NMR spectrum of PLLA-PEG copolymer.
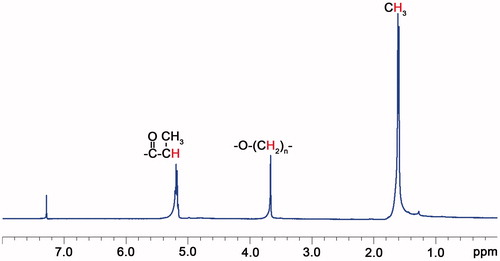
Figure 2. FTIR spectrum of PLLA-PEG copolymer.
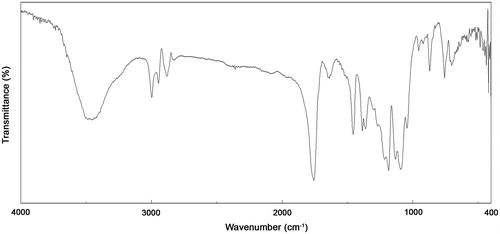
Figure 3. Representative SEM micrographs of PLA-PEG-PLA scaffolds: (A) Prepared without using salt particles copolymer conc. is 50 mg/mL; (B), (C), and (D) prepared with salt (with a conc. of 1 g NaCl/0.25 g polymer) with different amounts of the copolymer, 30, 50, and 80 mg/mL, respectively.
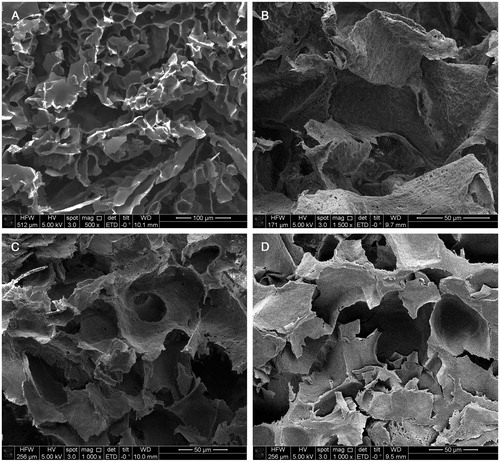
Figure 4. Release rates of VEGF and BMP-2 from scaffolds prepared by freeze drying plus salt leaching using 1 g NaCl/0.25 g polymer from copolymer solutions with 5% copolymer in diaxone.
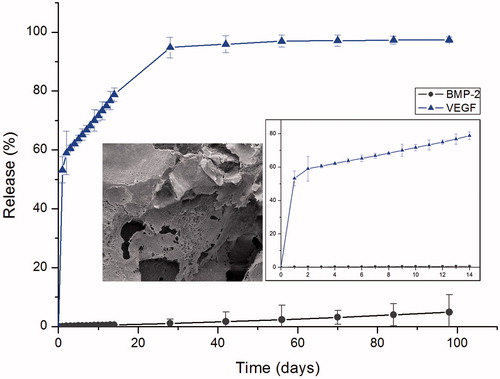
Figure 5. MC3T3-E1 mouse osteoblast cells on the scaffolds prepared by from 5% the copolymer solutions by freeze drying and salt leaching, plain and growth factor’s loaded–representative images: (A) and (B) SEM and fluorescence images of the plain scaffolds after 7 d culture, respectively; (C) and (D) SEM and fluorescence images of the plain scaffolds after 14 d; (E) and (F) SEM and fluorescence images of the scaffolds loaded with VEGF/BMP-2 after 7 d culture, respectively; and (G) and (H) SEM and fluorescence images of the scaffolds loaded with VEGF/BMP-2 after 14 d, respectively.
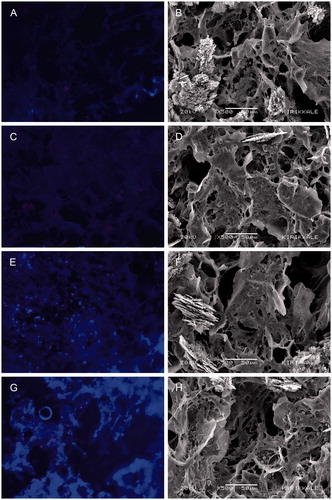
Table 1. WST-1 cytotoxicity test results.
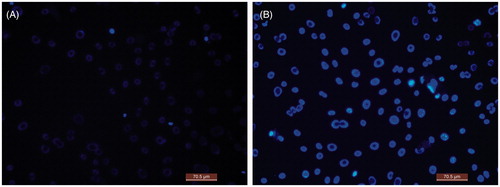
Figure 6. Representative fluorescence microscopy images of MC3T3-E1 on; (A) the plain scaffolds; (B) VEGF/BMP-2-loaded scaffolds.