Figures & data
Figure 1. (A) Synthetic route of arginine-modified chitosan (Arg-CS) and illustration (B) of the nanoparticles formed by Arg-CS and plasmid DNA.
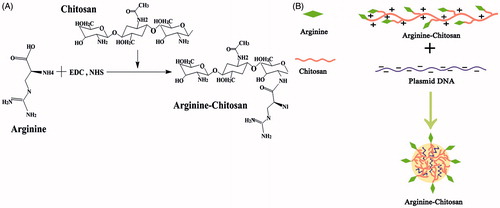
Figure 2. Physicochemical characterization. (A) FT-IR spectra of arginine, chitosan, and Arg-CS. (B) 1H NMR spectrum of arginine, chitosan, and Arg-CS in D2O with a concentration of 10 wt%.
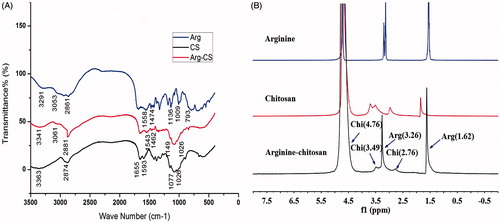
Figure 3. (A) The zeta potential of the Arg-CS/pBMP-2 nanoparticles; (B) Nanoparticles morphological analysis by TEM; (C) Gel electrophoresis of Arg-CS/pBMP-2 nanoparticles, digests, and control samples. Lane 1 shows the DNA marker. Lane 2 shows naked plasmid DNA. Lane 3 shows Arg-CS/pBMP-2 nanoparticles. Lanes 4 and 5 show naked plasmid DNA digested by DNase I (2U, 4U respectively). Lanes 6 and 7 show Arg-CS/pBMP-2 nanoparticles digested by DNase I (2U, 4U respectively).
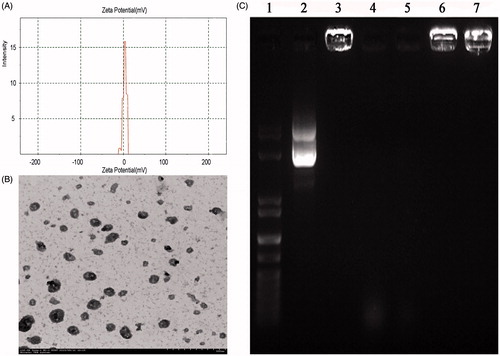
Figure 4. (A and B) The transfection efficiency of Arg-CS/pBMP-2 nanoparticles was determined by flow cytometry and fluorescent micrograph; (B) Western blot confirm the expression level of BMP-2 protein.
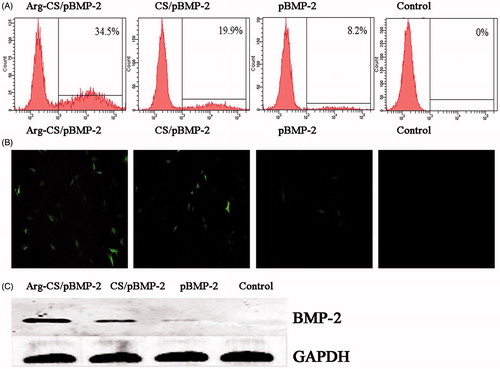
Figure 5. (A) SEM of PELA microcapsules. a and b: Arg-CS/pBMP-2 nanoparticles-loaded microcapsules (100×, 200×); (B) Arg-CS/pBMP-2 nanoparticles release profile from PELA microcapsules in PBS. (C) BMP-2 expressed in cultures was analyzed by ELISA. Data are presented as the mean ± standard deviation (n = 3). *P < 0.05; **P < 0.01.
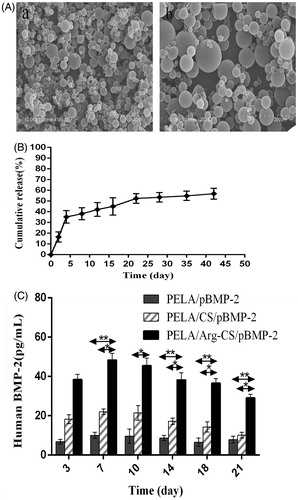
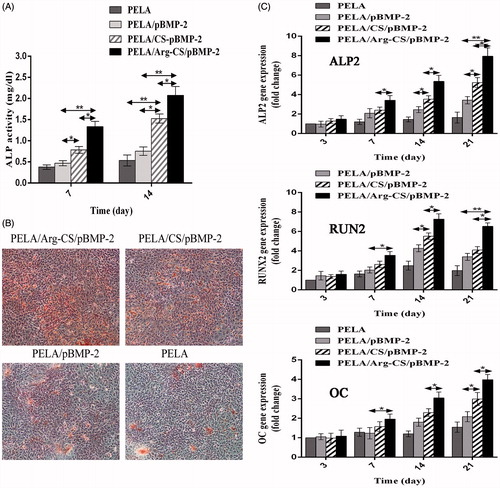
Figure 6. (A) Calcium deposition analysis using alizarin red staining. After 21 d, the MC3T3-E1 cells cultured with PELA microspheres loaded Arg-CS/pBMP-2 NPs showed a significant increase in calcium nodules formation. (B) In vitro ALP activity was measured at 7 d and 14 d. The group transferred with Arg-CS/pBMP-2 NPs showed the highest ALP activity level than the other transferred groups at days 7 and 14 (P<0.01). (C) Expression levels of ALP2, OC and Runx2 mRNA were quantified by real-time RT-PCR after 3, 7, 14, and 21 days post-transfection. Data are presented as the mean±standard deviation (n=3). *P<0.05; **P<0.01.