
Figures & data
Figure 1. (A) UV-Vis spectrum of the Fe3O4 nanoparticles (inset: The ear leaves covering corn used for the synthesis of Fe3O4 nanoparticles and, FeCl2 and FeCl3 as the precursor compounds in aqueous extract of corn ear leaves (yellow) and synthesized Fe3O4 nanoparticles (black)); (B) Scanning electron microscopy (FE-SEM, inset: Selected Fe3O4 nanoparticle for EDX analysis); and (C) energy-dispersive X-ray spectroscopy (EDX, inset: elemental composition of Fe3O4 nanoparticle) of the Fe3O4 nanoparticles.
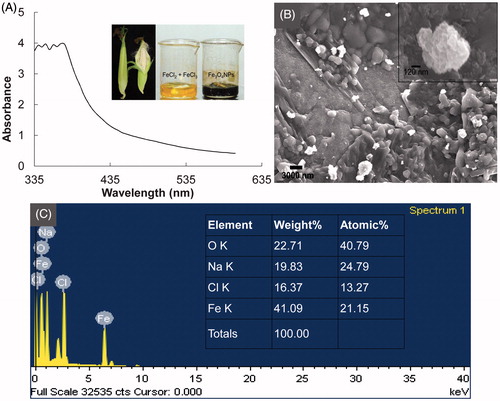
Figure 2. (A) Fourier-transform infrared spectroscopy [FT-IR; Fe3O4 nanoparticles (FeNPs) and aqueous extract of corn ear leaves (ELE)]; (B) Differential thermogravimetric (TG/DTG) spectra of Fe3O4 nanoparticles; (C) Vibrating sample magnetometer (VSM) graph of Fe3O4 nanoparticles (inset: indicates the magnetic properties of the synthesized Fe3O4 nanoparticles); and (D) X-ray diffraction (XRD) analysis of Fe3O4 nanoparticles.
![Figure 2. (A) Fourier-transform infrared spectroscopy [FT-IR; Fe3O4 nanoparticles (FeNPs) and aqueous extract of corn ear leaves (ELE)]; (B) Differential thermogravimetric (TG/DTG) spectra of Fe3O4 nanoparticles; (C) Vibrating sample magnetometer (VSM) graph of Fe3O4 nanoparticles (inset: indicates the magnetic properties of the synthesized Fe3O4 nanoparticles); and (D) X-ray diffraction (XRD) analysis of Fe3O4 nanoparticles.](/cms/asset/f13c7765-1b07-422e-9a8e-39184941b130/ianb_a_1153484_f0002_c.jpg)
Figure 3. Proteasome inhibitory (A) and antioxidant potential (B–E) of Fe3O4 nanoparticles. FeNP-10 and −100: Fe3O4 nanoparticle at a concentration of 10 and 100 μg/mL, respectively; Epox-1 and −10: epoxomicin at a concentration of 0.56 and 5.56 μg/mL, respectively; (B) ABTS radical scavenging assay; (C) Nitric oxide scavenging assay; (D) DPPH free radical scavenging assay; and (E) Reducing power assay. Different superscript letters indicate significant differences at P < 0.05.
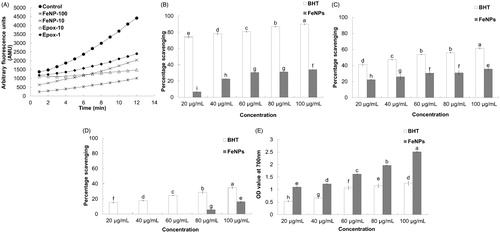
Figure 4. Synergistic antibacterial and anticandidal potential of Fe3O4 nanoparticles. (A) Fe3O4 nanoparticles (25 μg) + kanamycin (5 μg); (B) Fe3O4 nanoparticles (25 μg) + rifampicin (5 μg); and (C) Fe3O4 nanoparticles (50 μg) + amphotericin b (5 μg).
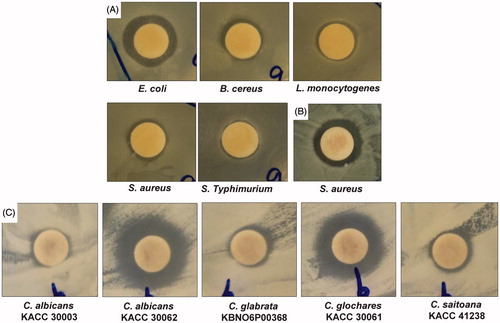
Table 1. Synergistic antibacterial and anticandidal activity of Fe3O4 nanoparticles against foodborne pathogenic bacteria.