Figures & data
Table 1. Optimization parameters for 5.0G dendrimers.
Table 2. Experimental layout for pharmacokinetic and organ distribution studies.
Figure 1. IR spectrum of 5.0G PPI dendrimers.
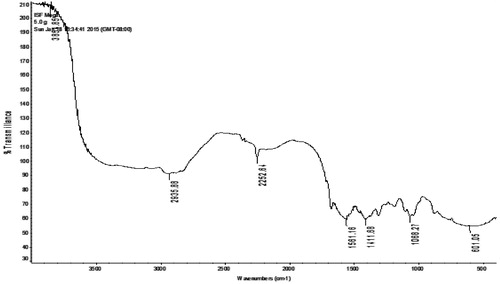
Figure 2. IR spectrum of MTX–PPI conjugate.
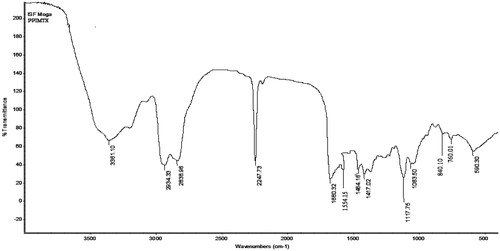
Figure 3. IR spectrum of FA–PPI conjugate.
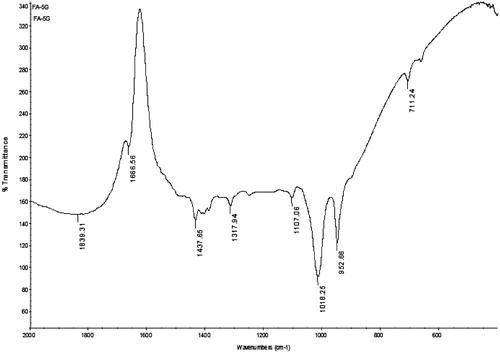
Figure 4. 1H NMR spectrum of FA–PPI conjugate.
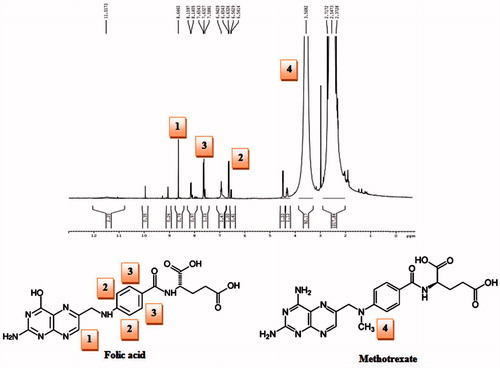
Figure 5. SEM image of MTX–FA–PPI conjugate.
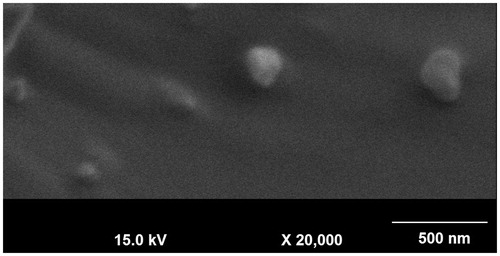
Figure 6. Size, polydispersity index of MTX-FA-PPI conjugate.
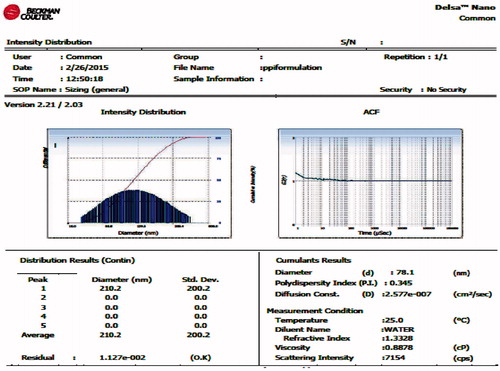
Figure 7. IR spectrum of MTX–FA–PPI conjugate.
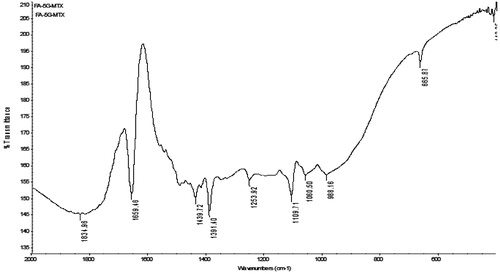
Table 3. Reported and observed peaks of MTX–FA–PPI conjugate.
Figure 8. DSC of MTX-FA-PPI conjugate.
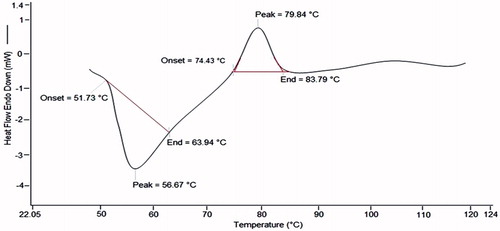
Figure 9. In vitro drug release profile of MTX–PPI and MTX–FA–PPI conjugate in PBS pH 7.4 and acetate buffer pH 5.0.
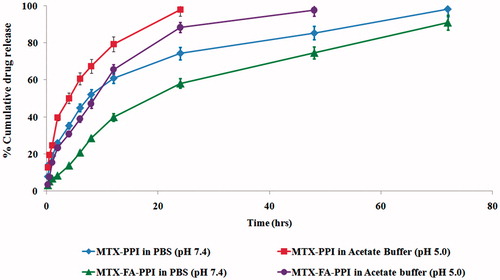
Figure 10. Percent cell viability of MCF-7 cells treated with various formulations after 24 h.
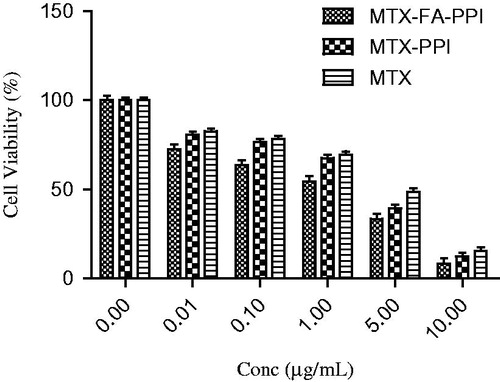
Figure 11. (A) Qualitative uptake of (a) MTX, (b) MTX-PPI, and (c) MTX-FA-PPI conjugates and (B) quantitative uptake in MCF-7 cells; (FA) representing pre-incubation with folic acid.
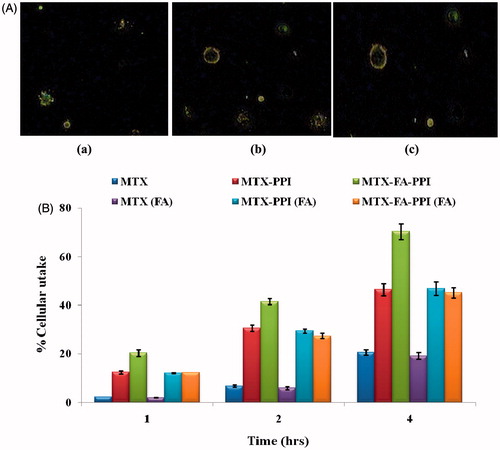
Figure 12. Plasma concentration versus time curve for various formulations.
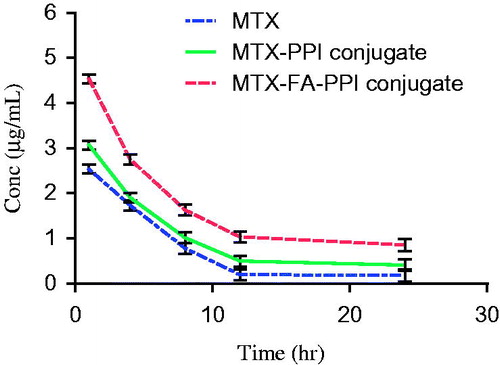
Table 4. Plasma pharmacokinetic parameters of different formulations.
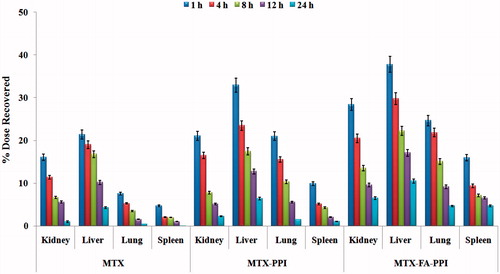
Figure 13. Percent drug in amount with respect to time in different organs.