Figures & data
Table 1. Treatment conditions of the studied groups.
Figure 1. Distribution curve of GNPs, based on their number [average diameter: 34 nm].
![Figure 1. Distribution curve of GNPs, based on their number [average diameter: 34 nm].](/cms/asset/106bc8b9-7ff7-499c-b2f7-8048a6528636/ianb_a_1167697_f0001_b.jpg)
Figure 2. Percentage of the cell survival in the presence of various concentrations of 5-ALA. Cell incubation period was selected for 4 h. The data represent mean ± standard error on the mean obtained from three performed experiments.
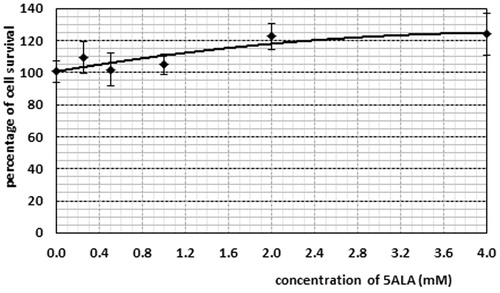
Figure 3. Percentage of cell survival in the presence of various concentrations of GNPs. Cell incubation time with GNPs: 4 h. The data represent mean ± standard error on the mean obtained from three performed experiments.
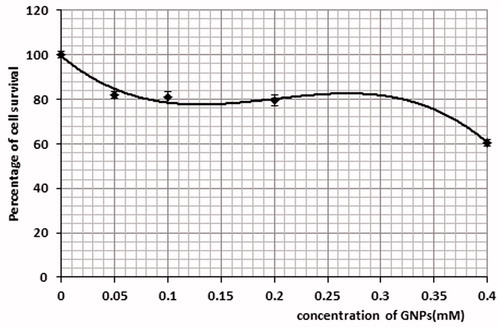
Figure 4. Percentage of cell survival in the presence of various concentrations of the conjugate. Cells incubation time with conjugate: 4 h. The data are expressed as mean of three repeated experiments ± standard error of mean.
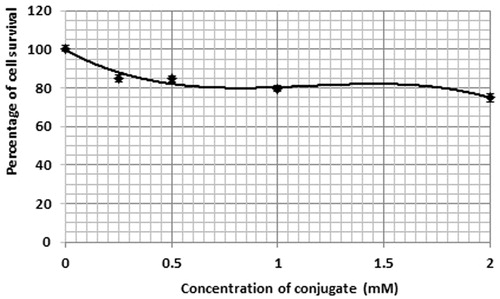
Figure 5. Fluorescence signal of protoporphyrin IX after four hours incubation time of Mel-Rm cells with 5-ALA and conjugate. The cell density was 3 × 10⁴ cell/ml and 5ALA concentration was 1 Mm. The control fluorescence signal was subtracted. The data represent mean ± standard error on the mean obtained from three performed experiments.
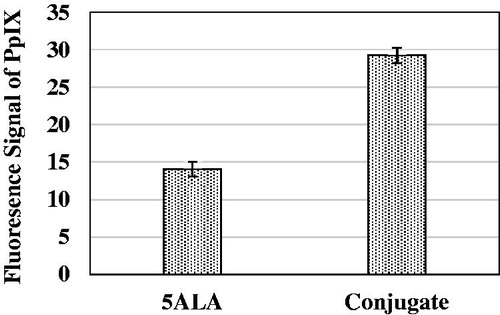
Figure 6. Percentage of cell survival in the presence of 5ALA, GNPs and conjugate with different x-ray doses, 24 h after treatment. The incubation time of GNPs was 4 h. The data are expressed as mean 3 experiments ± standard error of mean.
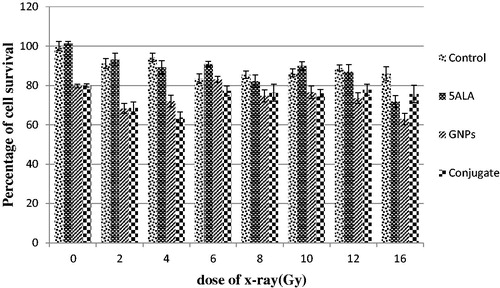
Figure 7. Percentage of cell survival of Mel-Rm cell line. 24 h after treatment. The incubation time of GNPs was 4 h. The data are expressed as mean 3 experiments ± standard error of mean.
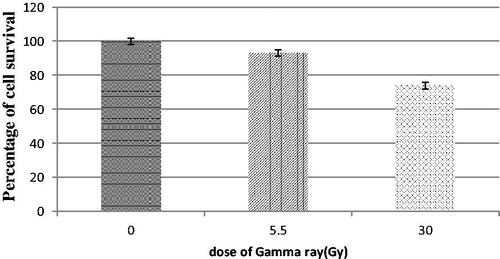
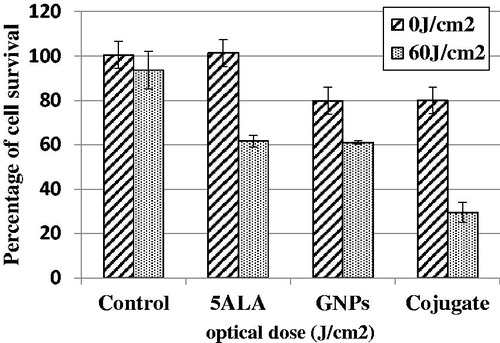
Figure 8. Cell survival percentage after different light doses irradiation, in the absence of drugs, in the presence of 5ALA, in the presence of GNPs and in the presence of conjugate 24 h after treatment. The data are expressed as mean of three repeated experiments ± standard error of mean.
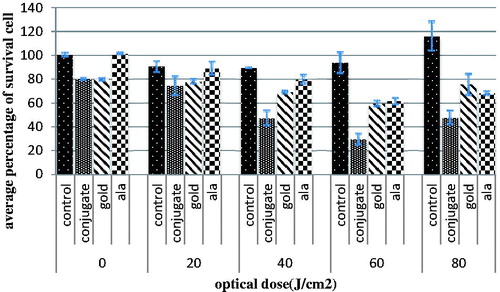
Figure.9. Cell survival percentage after different light doses irradiation, in the absence of drugs, in the presence of 5ALA, in the presence of GNPs and in the presence of conjugate 24 h after treatment at dose of 60 J/cm2. The data are expressed as mean of three repeated experiments ± standard error of mean.