Figures & data
Figure 1. Calibration curve for cell viability as measured using the WST assay for HEK cells cultured in 2D and 3D conditions prior to cryopreservation – representative viability for (i) cells encapsulated in alginate incorporating trehalose: Alginate + Trehalose in DMEM (diamonds); (ii) cells in 2D culture conditions after pretreatment and second incubation in trehalose: Trehalose + Trehalose in DMEM (squares); (iii) cells encapsulated in alginate not incorporating trehalose: Alginate + DMEM (triangles); and (iv) cells in 2D culture conditions after pretreatment trehalose: Trehalose + DMEM (circles).
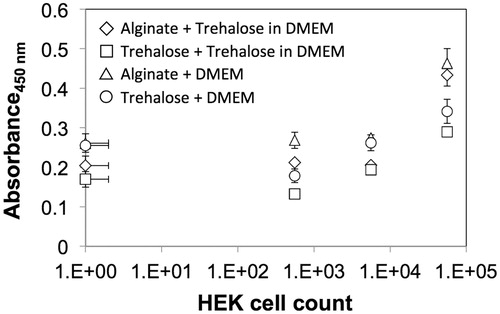
Figure 2. Schematic of the experimental process flow for optimization of cell culture conditions (2D and 3D) and cyroprotecant (CPA) treatment through cell viability testing.
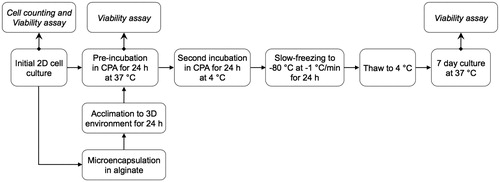
Table 1. L9 Taguchi experimental design.
Figure 3. Visual characterization of alginate microcapsules. (a) Representative pictures showing alginate-HEK microcapsules with an average diameter of 2.5 ± 0.5 mm. (b) Representative microscope images showing HEK cells encapsulated in alginate with a rounded morphology. White arrows show cells in focus.
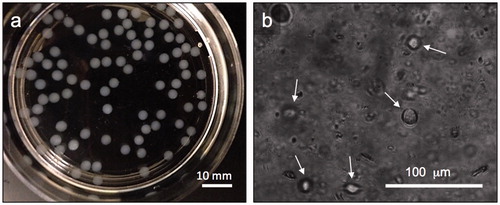
Figure 4. Influence of trehalose concentration on the viability of HEK cells cultured on TCPS at 37 °C following 24 h exposure to trehalose.
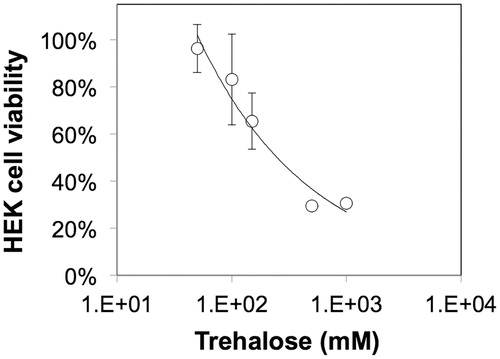
Figure 5. Viability of cells under the optimization conditions as described by the L9 Taguchi design measured on Day 7 post-thawing, normalized against non-cryopreserved alginate-encapsulated HEK cells incubated in DMEM. Runs 1 and 8 (denoted by asterisks) represent cells in 3D and 2D culture conditions, respectively, at the highest trehalose concentration (1200 mM) and in the absence of the pre-incubation step.
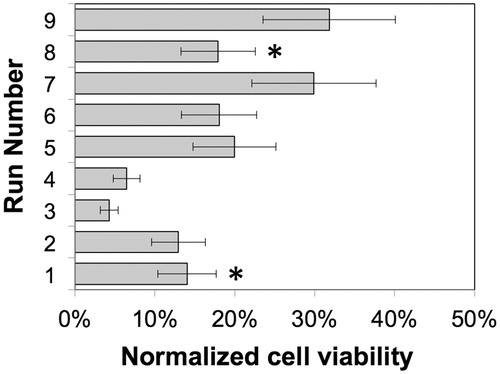
Figure 6. Signal-to-Noise (S/N) plots for the Taguchi L9 optimization by factor: cryoprotectant concentration (Tre), cryoprotectant uptake time (Uptime), pre-treatment trehalose concentration (PretreatC), and membrane material composition (Material).
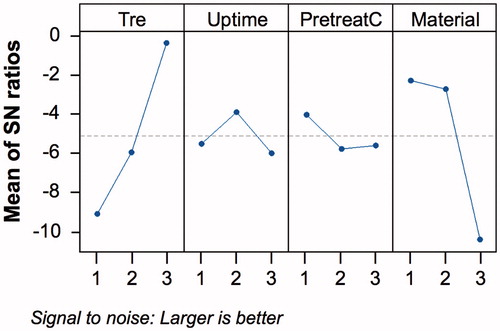
Table 2: Summary of L9 Taguchi analysis of cryoprotectant seeding using the Larger-the-Better optimization type.
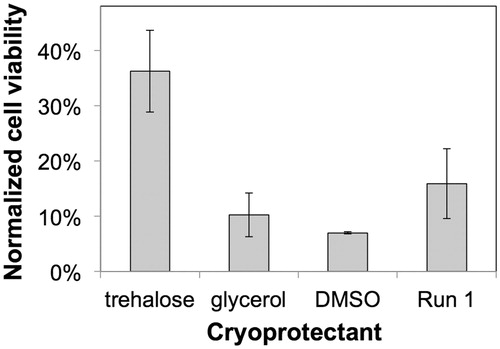
Figure 7. Comparative effect of cryoprotectants on the 7 day post-thaw cell viability of HEK cells microencapsulated in alginate. Alginate encapsulated cells were frozen with either 45% w/v trehalose, 10% w/v glycerol, or 10% w/v DMSO in DMEM, and compared to the post-thaw viability of microencapsulated cells minimally exposed to any CPA agent (Run #1). Cell viability for all the conditions were normalized against non-cryopreserved alginate-encapsulated HEK cells incubated in DMEM.