
Figures & data
Figure 1. XRD pattern of crystalline α-Fe2O3 NCs prepared by sol-gel method.
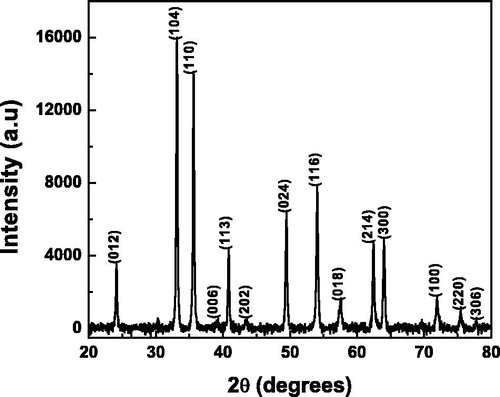
Figure 2. FT-IR spectra of laccase solution (a), and laccase immobilized α-Fe2O3NCs-CPE (b) showing formation of nanobiocomposite.
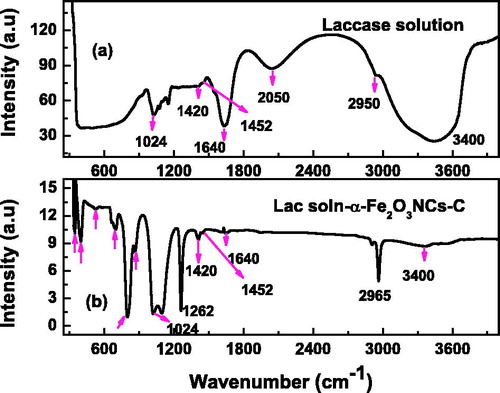
Figure 3. (a) CVs of α-Fe2O3 NC-modified CPE and BCPE in 10 mM of Fe(CN)63−/4− solution measured at a scan rate of 50 mV s−1; (b) Electrochemical impedance spectra of α-Fe2O3NCs–CPE in 10 mM of Fe(CN)63−/4− at a polarization potential of 0.2 V in a frequency range of 1–106 Hz. Inset shows corresponding spectra of BCPE.
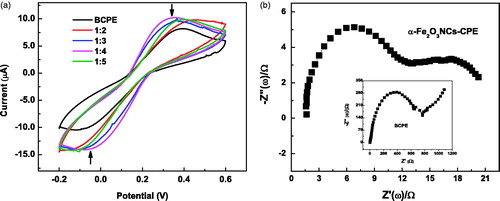
Figure 4. CVs of BCPE, α-Fe2O3NCs–CPE, and Lac-α-Fe2O3NCs–CPE in presence of 0.2-M pH 7 PBS solution in presence and absence of 1-mM catechol at a scan rate of 50 mV s−1.
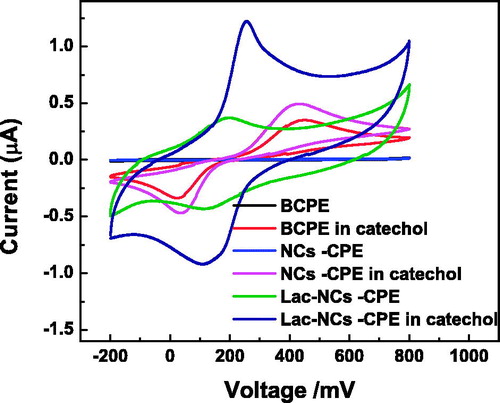
Figure 5. The plot of the peak current vs. the square root of the scan rate for α-Fe2O3 NCs–CPE (inset: CVs at different scan rates) in 0.2-M pH 7 PBS solution containing 1 mM of catechol.
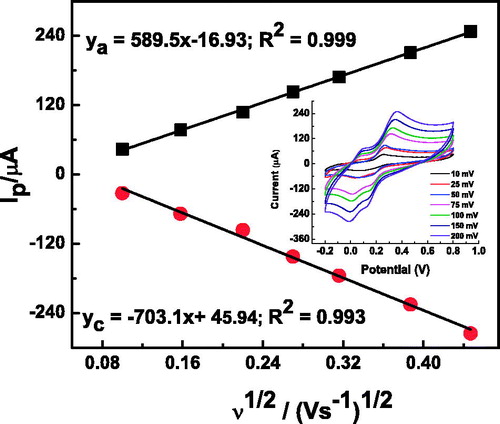
Figure 6. Schematic representation of laccase-catalyzed oxidation of catechol with its subsequent electrochemical reduction on the α-Fe2O3 NC-modified CPE.
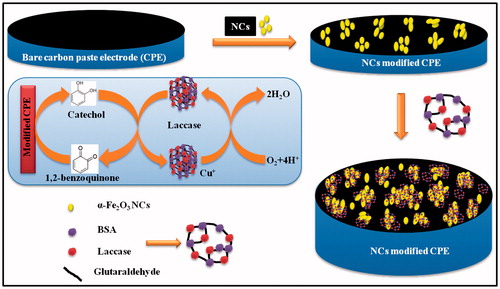
Figure 7. Effect of solution pH (a) applied potential (b) and temperature (c) on the steady-state current response of Lac-α-Fe2O3NCs–CPE in 0.2-M pH 7 PBS solution containing catechol.
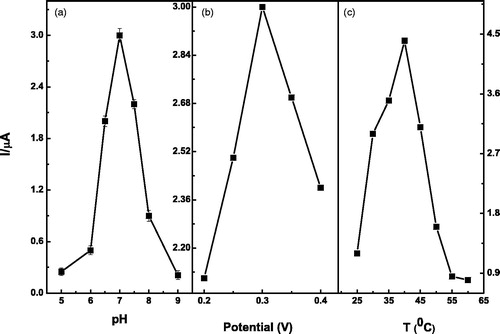
Figure 8. (a) Chronoamperometric responses of Lac-α-Fe2O3NCs–CPE on successive addition of different concentrations and volumes of catechol solutions into pH 7, 0.2 M of PBS solution at an applied potential of 0.3 V; (b) Calibration curve with nonlinear fitting for Lac-α-Fe2O3NCs–CPE response. Inset: Calibration curve with linear fitting.
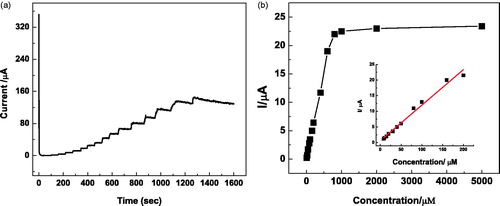
Table 1. A comparison of biosensing properties of various laccase-based catechol biosensors.
Figure 9. Relative responses of the biosensor for different phenolic compounds including catechol, 2-chlorophenol, 2-nitrophenol, guaiacol, and catechin. A total of 100 μM of the phenol in pH-7 PBS solution is used in all cases.
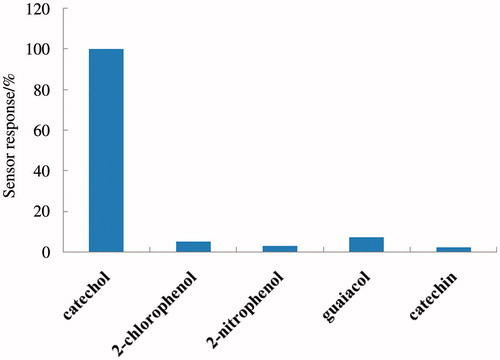
Table 2. Determination of catechol in real water samples.