Figures & data
Figure 1. Present application of magnetic nanoparticles in cancer disease: diagnosis (MRI) and therapy (hyperthermia, drug delivery and controlled release). Reproduced with permission from Elsevier (Lima-Tenoria et al. Citation2015), Copyright 2015.
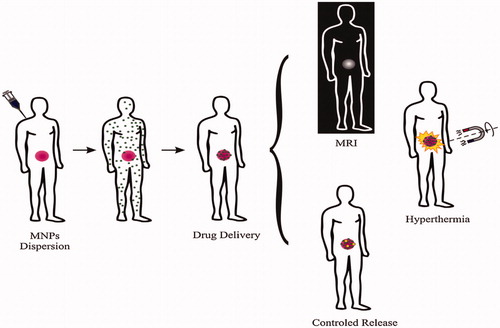
Figure 2. Scheme of an oil-in-water (O/W) micro-emulsion reaction method for synthesis of nanoparticles. Reproduced with permission from Elsevier (Lima-Tenoria et al. Citation2015), Copyright 2015.
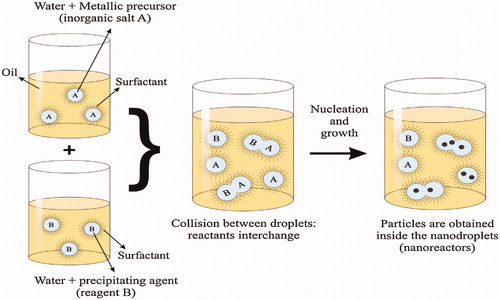
Figure 3. (a) Schematic depiction of ligand exchange strategy for very small-sized iron oxide nanoparticles using PO-PEG ligands and a TEM image of small-sized iron oxide nanoparticles before and after the ligand exchange. (b) Plot of 1/T1 over Fe concentration of iron oxide nanoparticles with diameters of 2.2 nm (▪), 3 nm (red •), and 12 nm (blue ▴). The slope designates the exact relaxivity (r1). (c) High resolution blood pool MR image following vein injection of small-sized iron oxide nanoparticles. Reproduced with permission from American Chemical Society (Kim et al. Citation2011), Copyright 2011.
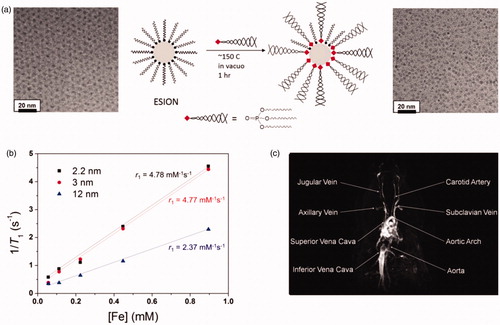
Figure 4. (a) Schematic representation of ligand encapsulation method for FIONs using lipid-PEG ligands. (b) TEM image of 31 nm FIONs applying lipid-PEG ligands. (b) TEM image of 22 nm FIONs dispersed in water (inset: HRTEM image). (c) Plots of r2 values of FIONs of different core sizes. FIONs with core dimension of 31 nm and encapsulated with 2100 Da phospholipid PEG exhibit an extremely high r2 relaxivity of 741 mM−1 s−1. (d) In vivo MR images of a tumor site before (left) and 1 h after (right) vein injection of FIONs (arrows indicate the tumor site) showing the significant reduction in the MR signal. Reproduced with permission from American Chemical Society (Lee et al. Citation2012), Copyright 2012.
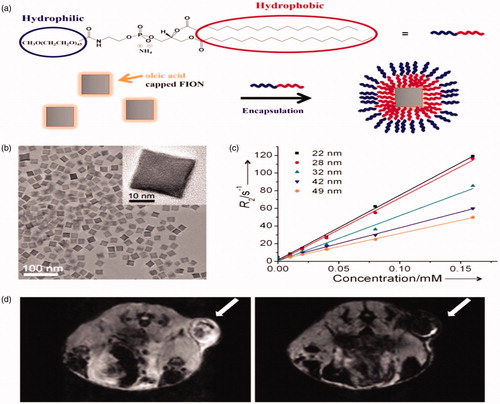
Figure 5. Stabilization of nanoparticles through manifold interface ligands. (a) Formation of hydrophilic nanoparticles by manifold interface ligands. (a) Formation of water-dispersible nanoparticles by multiple interaction ligand (MIL) stabilization. (b) In vivo stability tests: blood circulation data (plasma iron concentration versus time relationships) of MIL0, MIL1, and MIL2-functionalized Fe3O4 nanoparticles (inset). (c) Time-dependent T2-weighted MR images of the lymph node (arrow) in a nude mouse before and after intravenous administration of MIL2-functionalized Fe3O4 nanoparticles. Reproduced with permission from Wiley-VCH (Ling et al. Citation2011), Copyright 2011.
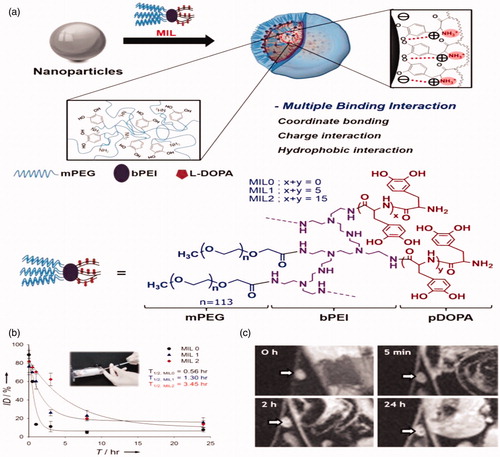
Figure 6. (a) In vivo MR images of Bel-7402 subcutaneous xenograft in nude mice attained after administration of Gd-DTPA (top row), Feridex (the second row), unmodified (the third row), and FA-BSA-modified magnetic micelles (bottom row) at different time points (10 min, 1, 24, 48, and 72 h). (b) Tumor-to-muscle signal ratios observed on T1 images of the groups treated with Gd-DTPA at different time points different time points (10 min, 1, 24, 48, and 72 h). (c) Tumor-to-muscle signal ratios observed on T2 images of the groups treated with Feridex, unmodified magnetic micelles, and FA-BSA modified magnetic micelles at different time points (10 min, 1, 24, 48, and 72 h). TMR, tumor-to-muscle signal ratios. Tumor volume: 400–700 mm3, n = 3–5 for each group (Li et al., Citation2015). Reproduced with permission from Elsevier (Li et al. Citation2015), Copyright 2015.
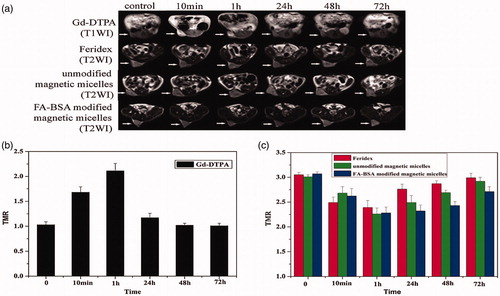
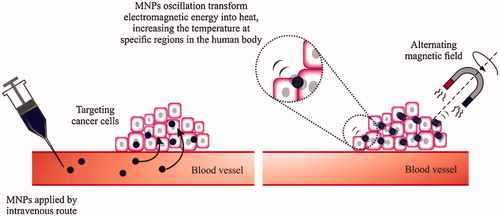
Figure 7. Schematic depiction of magnetic thermal therapy. Magnetic nanoparticles gather in tumors, aiming the cancer cells. When exposed to an alternating magnetic field, the nanoparticles incline to align with the applied field absorbing energy. MNPs fluctuating convert this electromagnetic energy into heat, increasing the temperature at this region. Reproduced with permission from Elsevier (Lima-Tenoria et al. Citation2015), Copyright 2015.