Figures & data
Figure 1. (A) Preparation steps of HSA nanoparticles, B(I) synthesis of o-carboxymethyl chitosan (CMCh), B(II) preparation steps of PHB–CMCh nanoparticles.
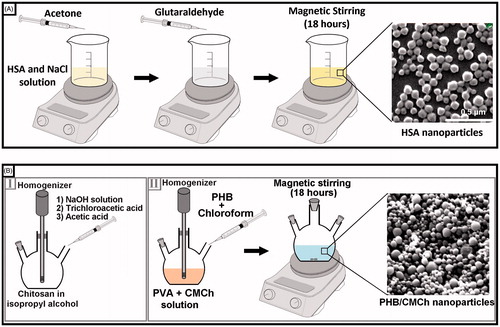
Figure 2. (A) SEM image of the HSA nanoparticles and (B) 2D AFM image of the HSA nanoparticles.
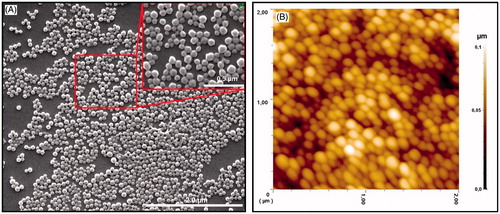
Table 1. Effect of the pH value, degree of crosslinking, polymer concentration on the size of HAS nanoparticles.
Figure 3. FTIR spectra of the CMCh, PHB polymer, and PHB–CMCh nanoparticles.
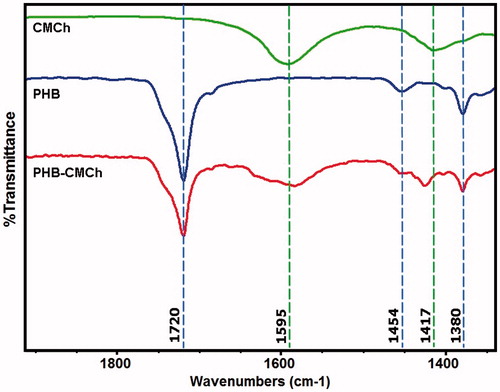
Figure 4. (A) SEM image of the PHB–CMCh nanoparticles and (B) 2D AFM image of the PHB–CMCh nanoparticles.
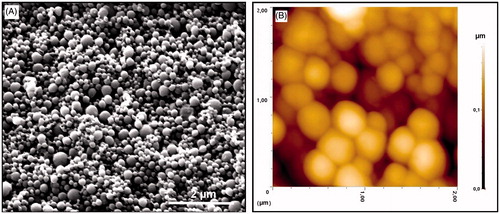
Table 2. Effect of the concentration of surfactant, polymer and stirring rate on the size, zeta potential, and polydispersity of PHB–CMCh nanoparticles.
Figure 5. Etoposide release profiles of HSA nanoparticles with (a) and without (b) lysozyme.
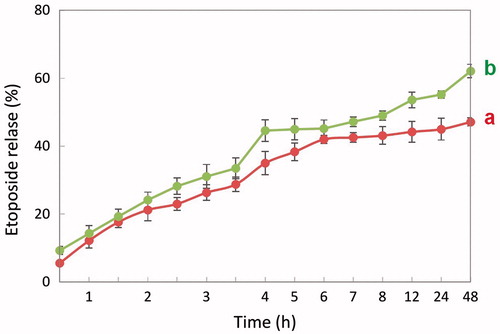
Figure 6. Etoposide release profiles of PHB–CMCh nanoparticles with (a) and without (b) lysozyme.
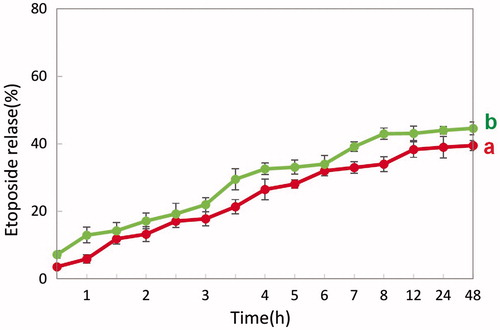
Figure 7. Cytotoxicity of different formulation of HSA nanoparticles (n = 3). The nanoparticles were incubated with MCF-7 cells for 24 h. After incubation, cell viability was measured by MTT assay. Data are expressed as percent of control mean ± SD of three independent experiments.
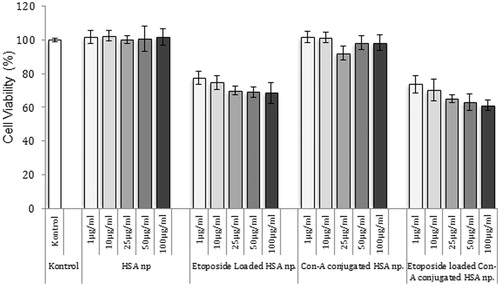
Figure 8. Cytotoxicity of different formulation of PHB–CMCh nanoparticles (n = 3). The nanoparticles were incubated with MCF-7 cells for 24 h. After incubation, cell viability was measured by MTT assay. Data are expressed as percent of control mean ± SD of three independent experiments.
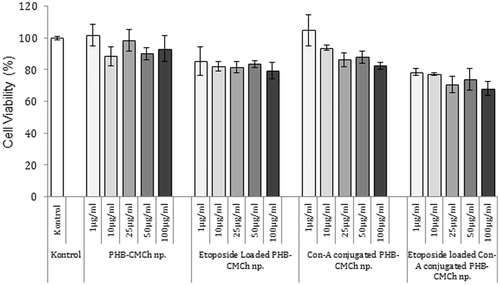
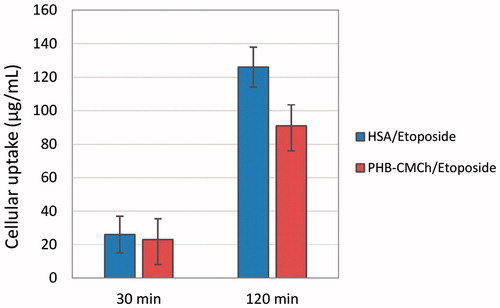
Figure 9. Uptake efficiency (μg/mL) of nanoparticles at 30 and 120 min.