Figures & data
Figure 1. Schematic representation of Class II (A) and onlay (B) preparation measurements in mm.
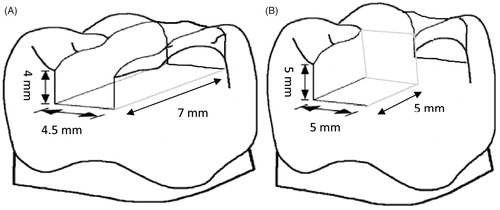
Table 1. The composite resins investigated and their composition.
Figure 2. Picture of sectioned specimen showing (A) microleakage at restoration margin and (B) no microleakage.
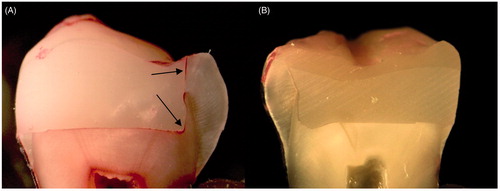
Figure 3. Schematic representation of onlay-shaped test specimens and the compressive load test setup. (A) Group made from plain composite resin; (B) group made of different composite base materials and 1 mm surface layer of composite resin; (C) group made only from short FRC resin.
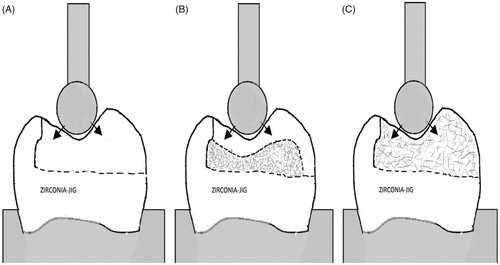
Figure 4. Mean percentage of microleakage observed in different groups from total margin length after 30 min and 24 h staining time. Vertical lines represent standard deviation. PFC refers to Tetric N-Ceram composite resin. Horizontal lines above the columns indicate groups that do not differ statistically from each other.
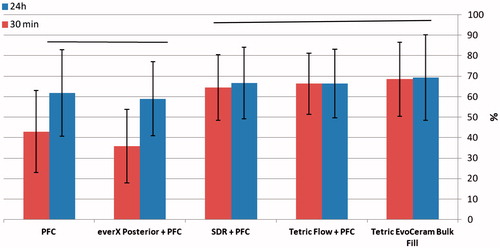
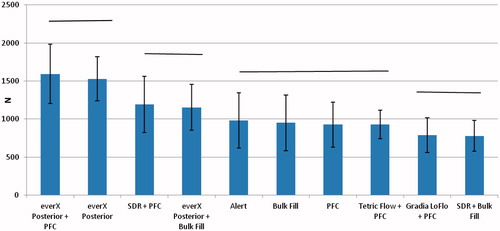
Figure 5. Mean values of compressive load-bearing capacity of onlay restorations. N refers to Newton; PFC refers to Tetric N-Ceram composite resin; Bulk Fill refers to Tetric EvoCeram Bulk Fill composite resin. Vertical lines represent standard deviations. Horizontal lines above the columns indicate groups that do not differ statistically from each other.