Figures & data
Figure 1. Finite elements model (FEM) of a crown composed by layers of quadrilateral elements simulating the core structure (green arrows) and layers of quadrilateral elements simulating the veneer structure (red arrows), green arrows indicate the veneer–core interface.
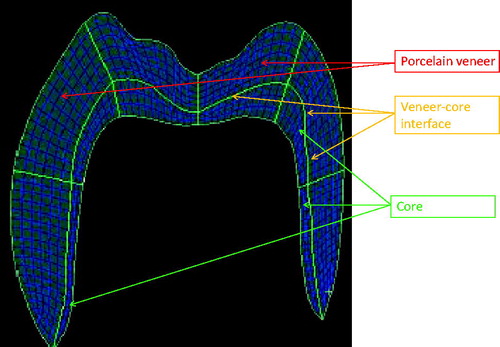
Table 1. Mechanical and thermal properties of simulated veneer materials.
Figure 2. FE model validation process. Strain gauge and temperature gage measuring systems setup.
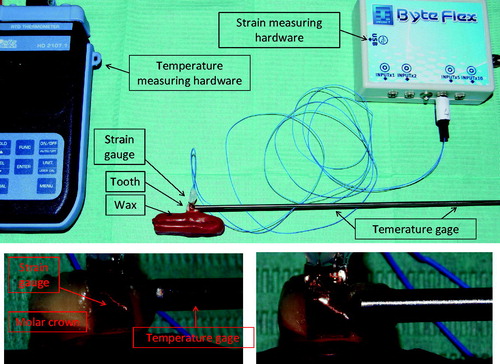
Figure 3. Strain–time function. Dotted lines divide the temperature phases applied to the molar crown.
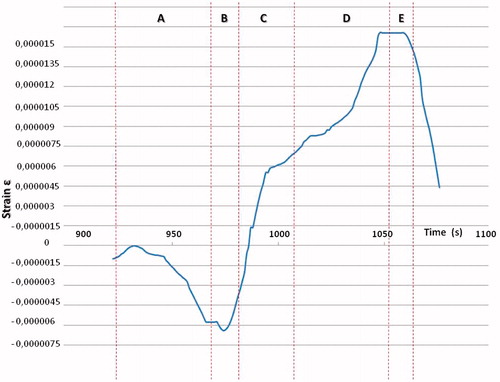
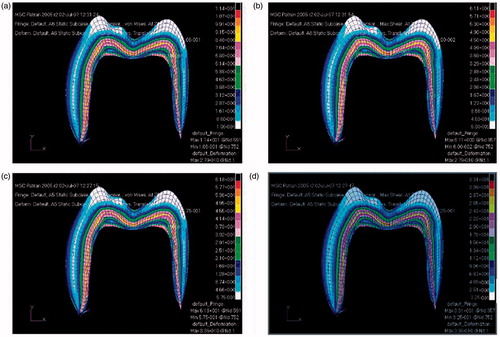
Figure 4. Maximum principal stress values and distribution (a and b) and maximum shear stress values and distribution (b and d) for model 2 Ceramco PFZ (a and c) and model 4 Triceram (b and d) ceramics.