Figures & data
Figure 1. The effect of three different titanates and gold-titanates on total bacterial proteins (A) L. casei (Lc) and (B) S. mutans (Sm) after 24 h incubation. Sterile water (H2O) and erythromycin were used as negative and positive controls, respectively. In each group (labeled as X-axis), the means ± the standard deviation (SD) of three independent experiments with each experiment set up in triplicate were expressed as bacterial protein concentration after treatment with various concentrations of titanates or gold titanates compared with controls. Each titanate or gold-titanate group is represented by different colors. ***p value <0.001 compared with negative control (bacteria-only).
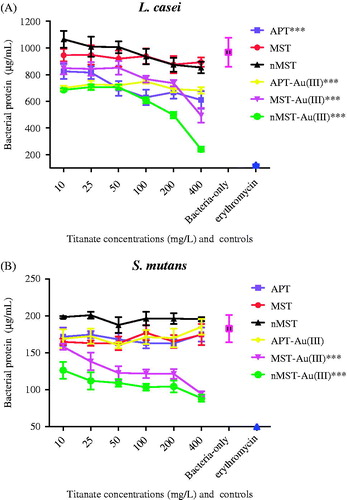
Figure 2. Image of live (green) and dead (red) cells of untreated Sm (left) and treated Sm with 400 mg/L nMST-Au(III) (right) after stained with L/D staining kit at 14 h, taken under fluorescence microscope (100×), and processed by using ImageJ™ image analysis program.
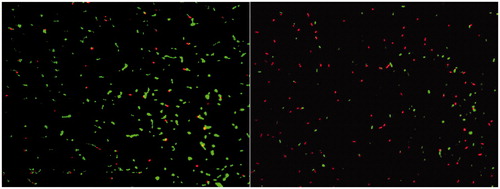
Figure 3. The effect of 10, 200 and 400 mg/L (low, medium and high concentrations) nMST-Au(III) on Lc growth curves at 37 °C over time (A) all time points (0–16 h) and (B) 0–6 h. All concentrations showed antibacterial activity on Lc growth. High concentration worked as antibacterial agent to highly inhibit Lc at as early as 2 h.
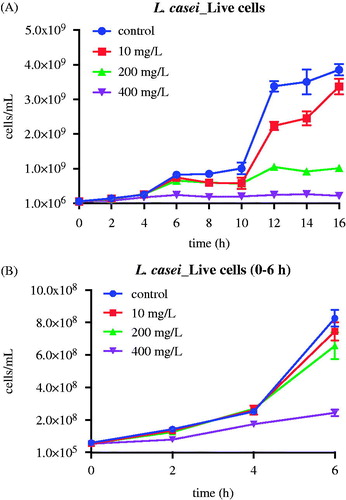
Figure 4. The effect of 10, 200 and 400 mg/L (low, medium and high concentrations) nMST-Au(III) on Sm growth curves at 37 °C over time. Only medium and high concentrations were able to affect Sm growth. High concentration had no effect on Sm cell numbers for up to 6 h.
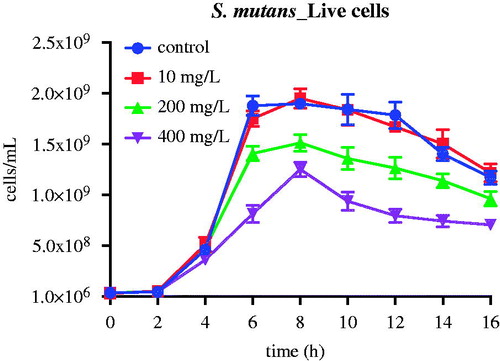
Figure 5. The effect of nMST-Au(III) on CFUs of Lc after 16 h. (A) Untreated control and all three concentrations compared (B) only high and medium concentrations compared. All concentrations of nMST-Au(III) showed inhibitory effect on Lc growth. High concentration was the most effective concentration against Lc growth and affected lag phase.
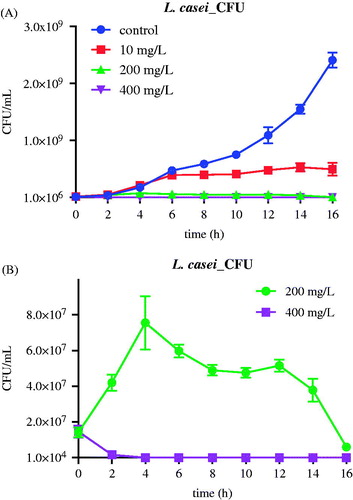
Figure 6. The effect of nMST-Au(III) on CFUs of Sm after 16 h. High concentration is the most effective concentration against Sm growth curve.
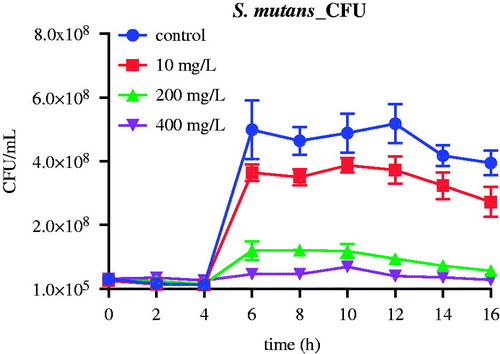
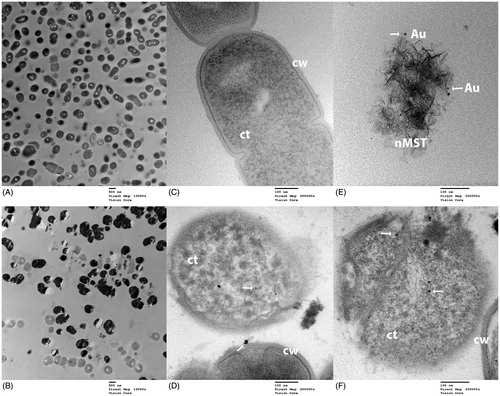
Figure 7. TEM images of L. casei (Lc) and nMST-Au(III) (A) and (C) untreated Lc images taken at magnification 12,000× and 120,000×, respectively. Bacterial cell wall (cw) and cytoplasm (ct) were marked. (B) and (D) Lc with nMST-Au(III) images taken at magnification 12,000× and 120,000×, respectively: arrows point to the nanoparticles (NPs) attached to bacterial cell wall (cw) and internalized into bacterial cytoplasm (ct) (E) arrows point to gold (Au) NPs in nMST compared in size, shape and density with (F) arrows pointing to NPs in Lc with nMST-Au(III). Image taken at magnification 250,000×.
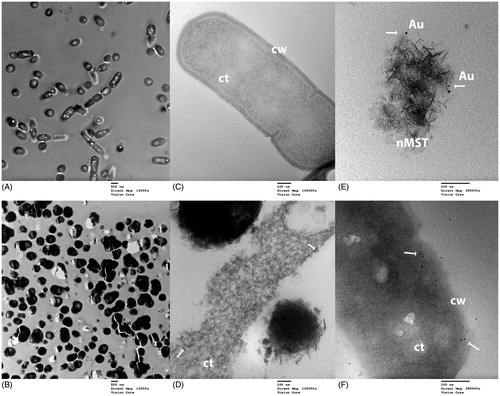
Figure 8. TEM images of S. mutans (Sm) and nMST-Au(III) (A) and (C) untreated Sm images taken at magnification 12,000× and 120,000×, respectively. Bacterial cell wall (cw) and cytoplasm (ct) were marked. (B) and (D) Sm with nMST-Au(III) images taken at magnification 12,000× and 120,000×, respectively: arrows point to the nanoparticles (NPs) attached to bacterial cell wall (cw) and internalized into bacterial cytoplasm (ct) (E) arrows point to gold (Au) NPs in nMST compared in size, shape and density with (F) arrows pointing to NPs in partial rupture of Sm cell with nMST-Au(III). Image taken at magnification 250,000×.