Figures & data
Figure 1. Structures of monomers used in the study (A) bisGMA (B) PEM (C) TEGDMA.
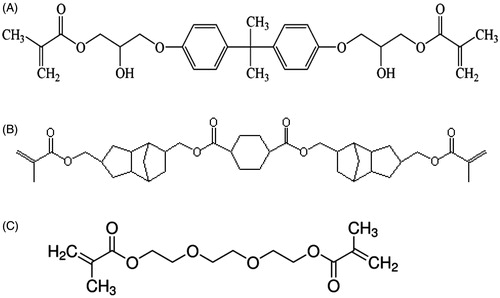
Table 1. Materials.
Figure 2. DSC set up for heat of cure measurements. The VIP light is mounted on a stand with the light tip at the top of the DSC cell. The light tip was maintained at the same distance from the sample pan to ensure uniform light exposure conditions during all experiments.
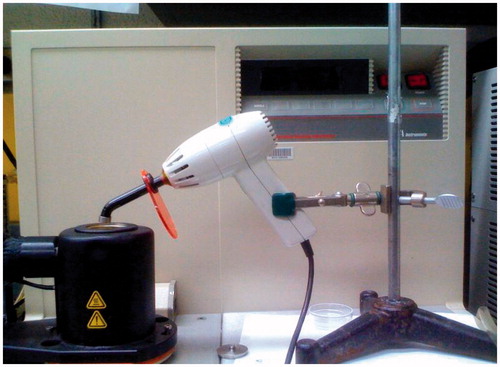
Figure 3. Heat flow(W/g) change as a function of light exposure time. The first exotherm represents the heat generated (J/g) by monomer conversion as well as the heat contributed directly by the light. The subsequent exotherms show approximately the same amount of heat and is associated only with light.
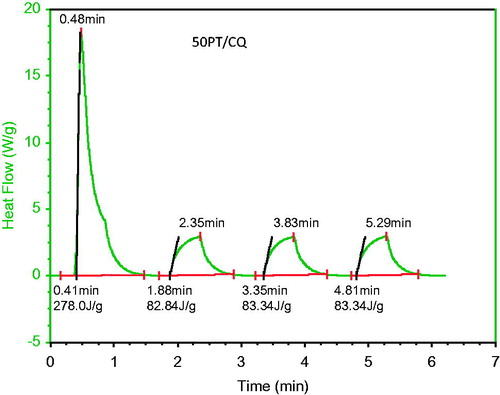
Table 2. Summary of ANOVA results.
Figure 4. Bar graph of heat of cure (J/g) means and (SD) for different monomer mixtures. Note the higher heat of cure means associated with diluent-rich monomers, as expected.
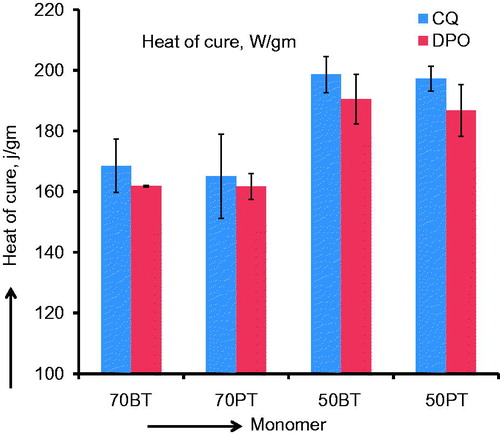
Figure 5. Bar graph of molar heat of cure (kJ/mole) and (SD) for different monomer mixtures. Note the higher molar heat of cure means for PEM mixtures vis-à-vis BisGMA mixtures.
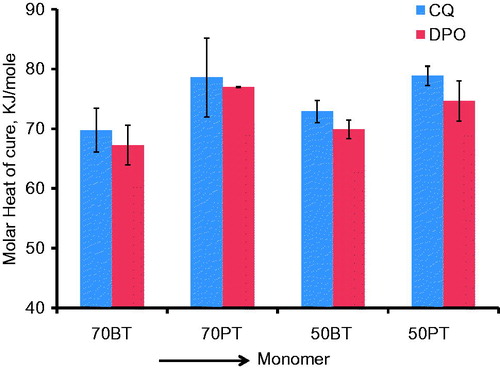
Figure 6. Bar graph of % conversion means and (SD) for different monomer mixtures.
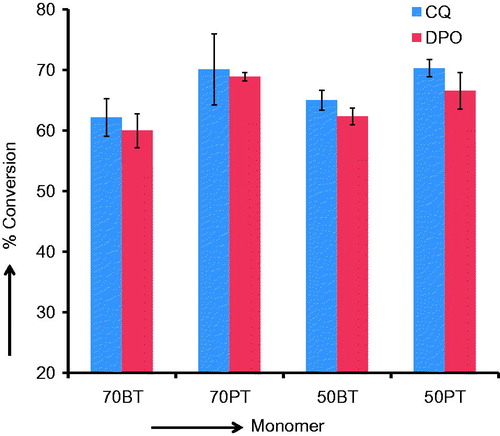
Figure 7. (A) Tukey–Kramer contrast of mean % conversion means of different monomers (ignoring initiator differences). Note that PEM resins have statistically higher mean % conversion than BisGMA (B) Tukey–Kramer contrast of mean % conversion means based only on initiators (without differentiating monomers and monomer/diluent proportions). Note that overall % conversion is similar for CQ and DPO.
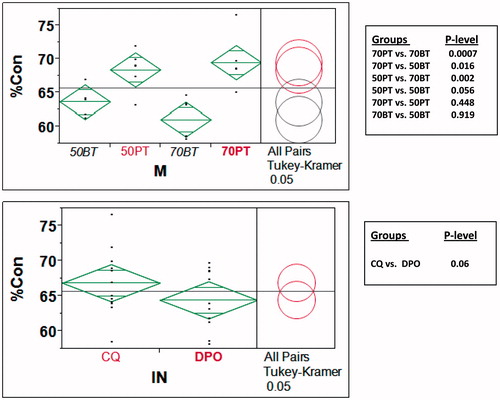
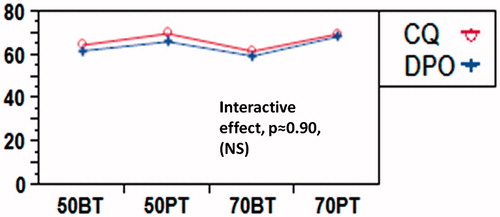
Figure 8. Profile plot of interactive effects of monomer/diluent proportions and initiators. There is no interactive effect at different levels of monomer/diluents ratios.