Figures & data
Table 1. Materials used in the study.
Figure 1. X-ray diffraction patterns of monolithic zirconia: (a) before aging, (b) after aging with monoclinic (m) peaks.
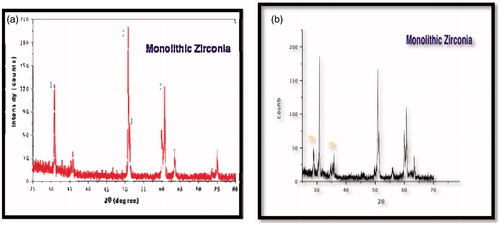
Figure 2. X-ray diffraction patterns of core zirconia: (a) before aging, (b) after aging with monoclinic (m) peaks.
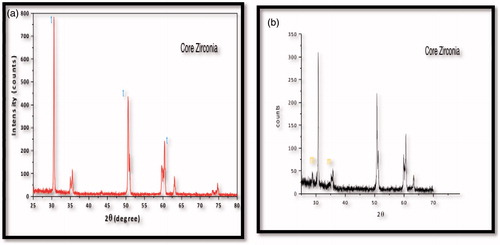
Table 2. Volumetric monoclinic phase content of aged Y-TZP (Vm).
Table 3. Average grain particle size for both Y-TZP types before and after aging.
Table 4. Student’s t-test of translucency for both materials before and after aging.
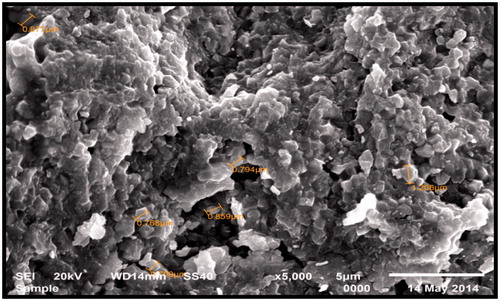
Figure 3. SEM images of monolithic Y-TZP before aging showing the less dense structure before aging (magnification 5000).
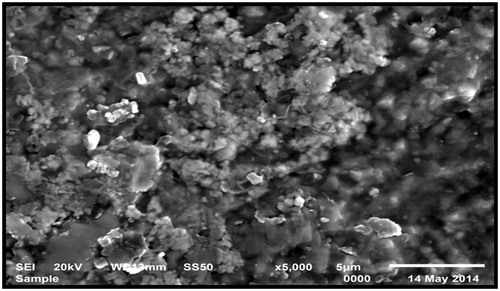
Figure 4. SEM images of core Y-TZP before aging showing the more dense structure before aging (magnification 5000).