Figures & data
Figure 1. Normalized particle size distributions for BO and three PC samples of differing size.
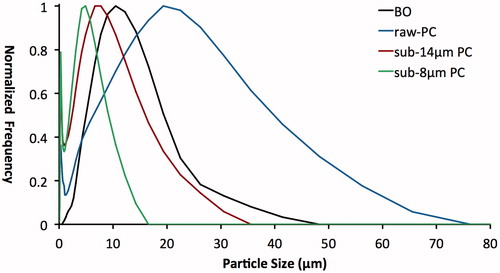
Table 1. Particle size distribution of PC and BO libraries, MTA-P and MTA-A.
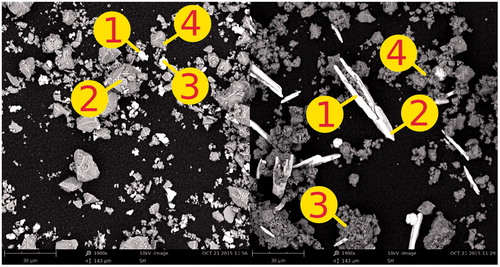
Table 2. Energy-dispersive X-ray spectroscopy (EDX) on points in .
Figure 2. Particle size distribution of MTA-P and MTA-A and the associated deconvoluted components.
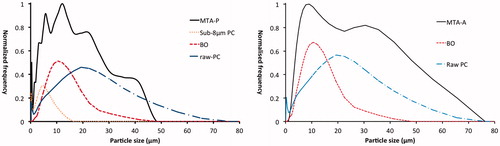
Figure 3. SEM images of MTA-P (left) and MTA-A (right). Bismuth oxide (white) and Portland cement particles (grey) particles can be seen. Refer to for EDX of four points from each image.