
Figures & data
Figure 1. Schematics of specimens. (A) specimen without reinforcement, (B) specimen reinforced with metal wire reinforcement, (C) specimen reinforced with FRC reinforcement.
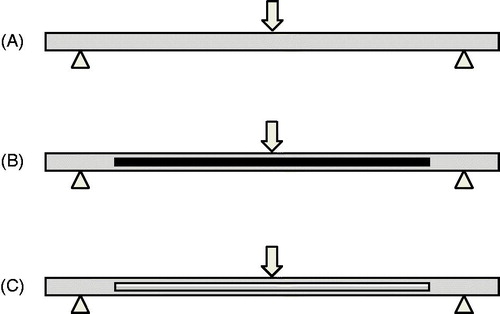
Figure 2. Representative load/deflection graph. PL: the load at the proportional limit, Max: the ultimate load.
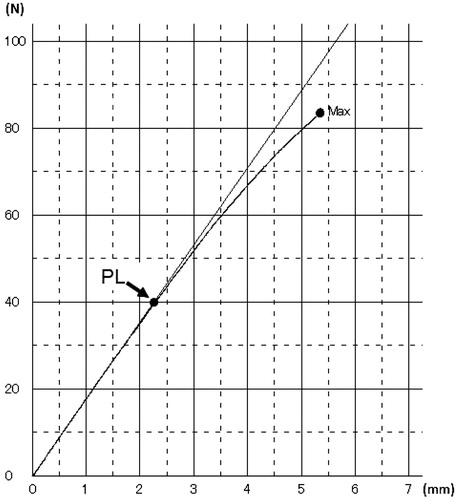
Table 1. Mean and standard deviations (SD) of ultimate flexural strength and flexural strength at the proportional limit of the reinforced denture base resins after 50 h and 180 d water immersion (n = 10).