
Figures & data
Table 1. Materials, compositions and application modes.
Figure 1. Mean bond strength values (in Mpa) for the experimental groups; *statistically different (p < 0.05).
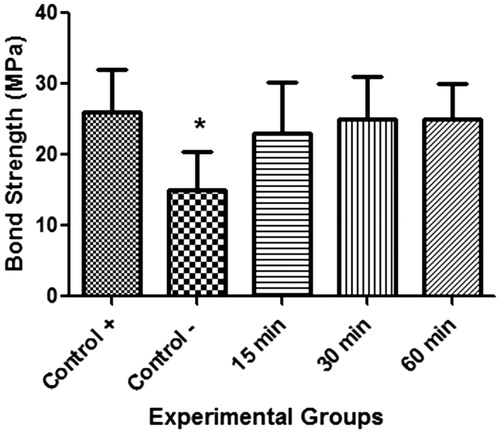
Table 2. Mean microtensile bond strength (standard deviations) in MPa for the different experimental conditions .
Table 3. Fracture modes of specimens and their representative percentages (%).