Figures & data
Figure 1. Morphological and crystalline characterization of the synthesized CMC-AgNPs composite. (A) A HAADF-STEM image showing several nanoparticles (brighter zones) that are grouped in the CMC matrix (darker background). (B) A BF image where the quasi-spherical morphology of the nanoparticles can be observed. (C) Particle size distribution of the composite. (D) The nanoparticles display a regular atomic arrangement that is congruent with that reported for family planes {111} of silver crystalline structure, having a regular spacing of 2.3 Å (JCPDS: 04–0783). SAED pattern obtained from the zone shown in B confirms the crystalline structure of the nanoparticles (inset Figure 1D).
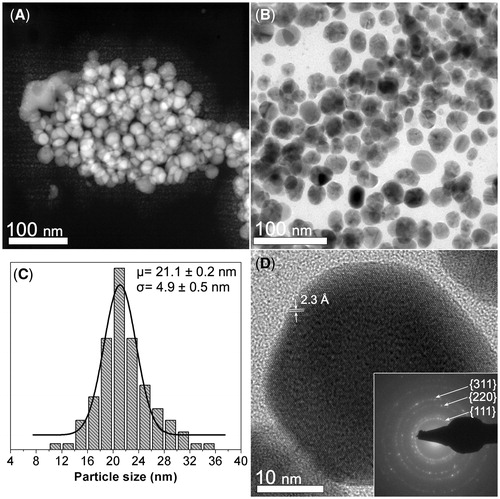
Figure 2. The spectrum obtained from CMC-AgNPs composite does not show an absorption band that agrees with that observed at 301 nm in the spectrum of AgNO3 reagent, but it shows a well defined band around 400 nm that is congruent with the surface plasmon resonance phenomenon reported for silver nanoparticles.
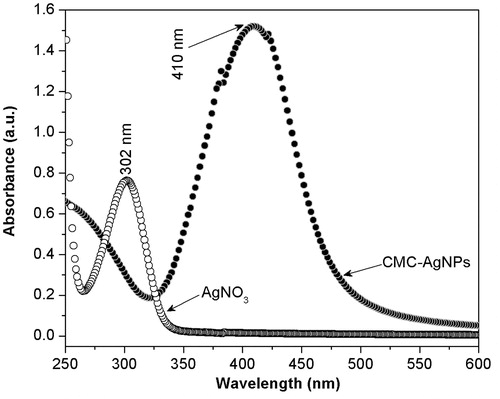
Figure 3. SEM images obtained at different magnifications from one of the coated Ti plates using BSE technique. (A) A low magnification image shows the composite coating (dark zone) on the Ti plate (brighter background). (B) AgNPs (brighter dots) are dispersed in the CMC matrix (darker background). (C) Shows the morphology of the AgNPs at 160 kX, which agrees with that obtained from TEM characterization of the composite.
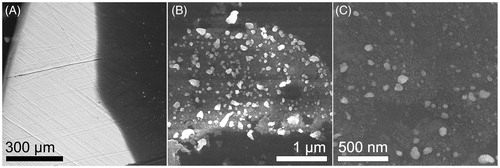
Table 1. Diameter of inhibition zone with AgNPs, chlorhexidine and a negative control.
Table 2. Tukey test of antimicrobial effect on S. mutans and P. gingivalis with three different AgNPs concentrations (16, 50, and 100%).
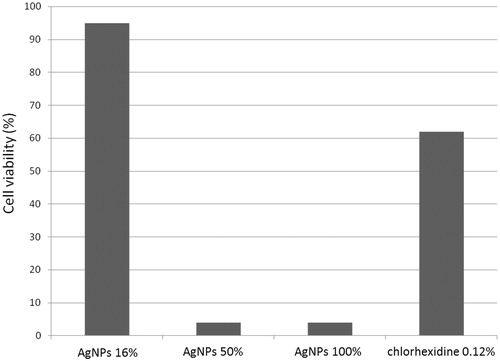
Figure 4. Viability of dental pulp stem cells (DPSC) with different concentrations of AgNPs and chlorhexidine 0.12%.