Figures & data
Figure 1. Health states used in the Markov model, and permitted transitions between states.
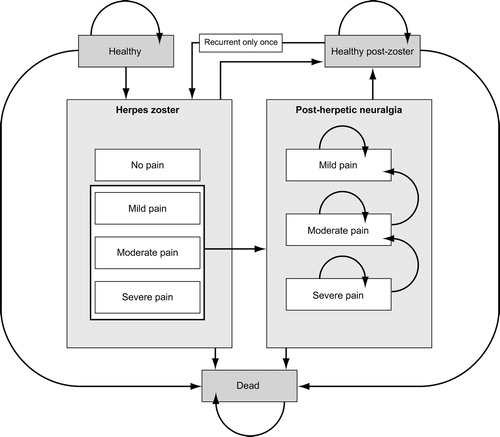
Table 1. Model inputs: epidemiology, vaccine characteristics and utilities.
Table 2. Model inputs: healthcare resource use (2007 prices). Monthly costs.
Table 3. Costs of lost productivity due to HZ and PHN.
Table 4. Base-case analysis: lifetime cost-effectiveness in individuals aged 60 years and older.
Table 5. Subgroup analyses: lifetime cost-effectiveness by age group.
Figure 2. Tornado diagrams showing the outcome of deterministic sensitivity analyses from third party payer (a), healthcare (b) and societal (c) perspectives. The vertical line represents the base-case incremental cost-effectiveness ratio (ICER; cost per quality-adjusted life year [QALY]), as shown in . The bars represent the change in ICER resulting from alterations in the variable shown on the left of the figure. GPRD, General Practice Research Database; HZ, herpes zoster; PHN, post-herpetic neuralgia; SPS, Shingles Prevention Study.
![Figure 2. Tornado diagrams showing the outcome of deterministic sensitivity analyses from third party payer (a), healthcare (b) and societal (c) perspectives. The vertical line represents the base-case incremental cost-effectiveness ratio (ICER; cost per quality-adjusted life year [QALY]), as shown in Table 4. The bars represent the change in ICER resulting from alterations in the variable shown on the left of the figure. GPRD, General Practice Research Database; HZ, herpes zoster; PHN, post-herpetic neuralgia; SPS, Shingles Prevention Study.](/cms/asset/eb9a30e7-67ab-4689-8480-26ee6465163b/ijme_a_502854_f0002_b.jpg)
Figure 3. Scatter plots showing the outcome of probabilistic sensitivity analyses using Monte Carlo simulations. Results are presented as costs per quality-adjusted life year (QALY) from third party payer (a), healthcare (b) and societal (c) perspectives.
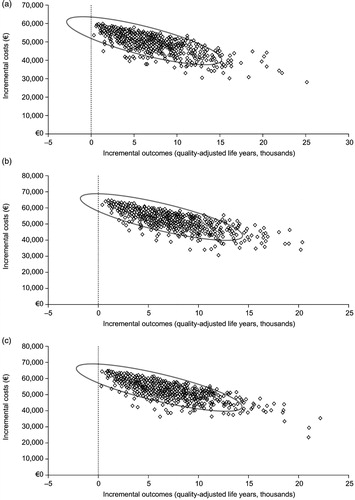
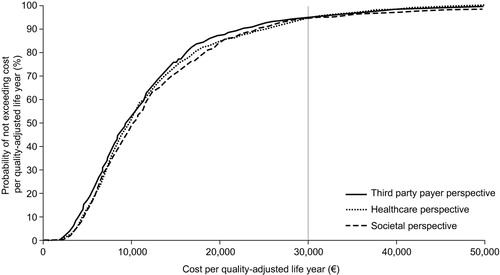
Figure 4. Cost-effectiveness acceptability curve. The dotted line indicates the unofficial Belgian threshold for cost-effectiveness of €30,000.