Figures & data
Table 1. Baseline characteristics, secondary outcomes, and derived annual probabilities (From Ramsey et al. 1999Citation14).
Table 2. Model inputs and sources for use of tobramycin inhaled solution in cystic fibrosis.
Table 3. Budget impact results of increasing use of tobramycin inhaled solution in cystic fibrosis patients.
Figure 1. One-way sensitivity analysis of incremental budget impact of tobramycin inhaled solution comparing current formulary to year 1 for health plan of 5,000,000 members. *TIS, tobramycin inhaled solution; †IV anti-PA, IV anti-pseudomonal.
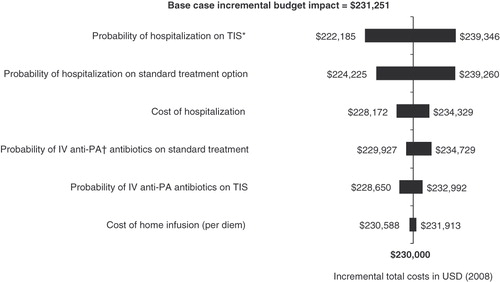
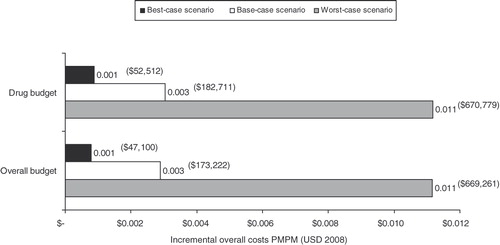
Figure 2. Scenario analyses for a managed-care organization population of 5 million: PMPM costs after 5% increase in use of tobramycin inhaled solution. PMPM, per member per month.