Figures & data
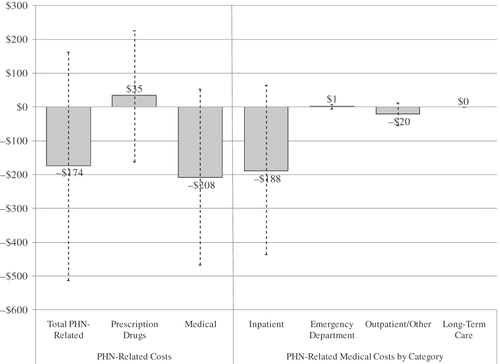
Figure 1. Sample Selection.
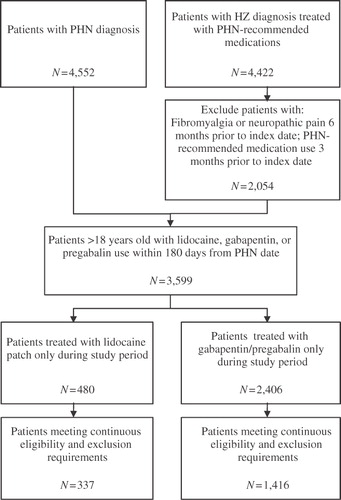
Table 1. Baseline characteristics and comorbidities.
Table 2. Study period (6-month) healthcare resource utilization.
Table 3. Mean study period (6-month) healthcare costs.
Figure 2. Study period (6-month) differences in mean PHN-related costs – lidocaine patch vs. gabapentin/pregabalin. Dotted lines represent 95% confidence intervals; costs were compared using bias-corrected bootstrapping. PHN-related costs were calculated over the 6-month study period and inflated to 2007 US dollars using the CPI for medical care. Differences in mean costs were defined as mean per-patient costs in the lidocaine patch group minus mean per-patient costs in the gabapentin/pregabalin group.