Figures & data
Figure 1. Sample selection and matching procedure flow chart.
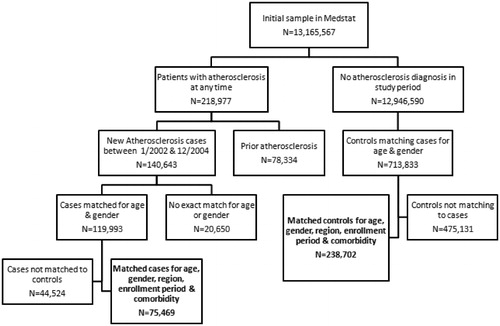
Table 1. Characteristics of atherosclerosis patients (ICD-9 diagnostic code for coronary or cerebral atherosclerosis) and matched comparison patients.
Figure 2. Cumulative rate for cardiovascular events (myocardial infarction, stroke, revascularization) after the index date per 1,000 patients for atherosclerosis and comparison patients, up to 12 months after the index date.
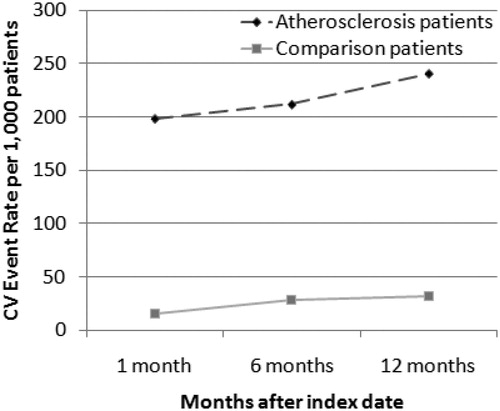
Figure 3. Overall monthly pre- and post-index date direct cost of care at 6 and 12 months for atherosclerosis patients and comparison cohort. Each time period includes those patients with complete follow-up for the specified period.
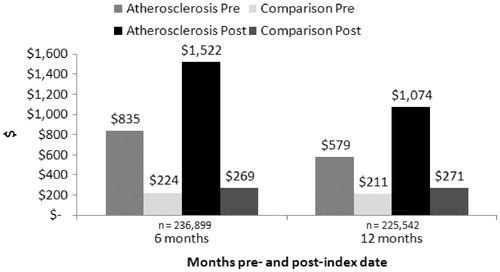
Table 2. Component costs of care and cost difference for 6 and 12 months before and after the index date for atherosclerosis patients and comparison cohort.
Table 3. Total costs of care and cost difference at 12 months before and after the index date for patients with diabetes mellitus.
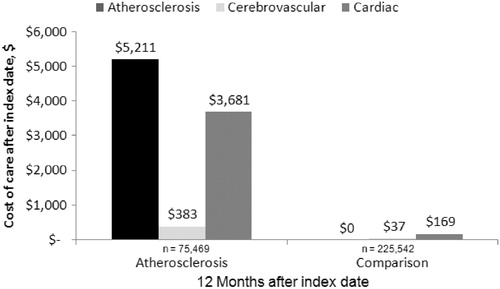
Figure 4. Cardiovascular-related cost of care 12 months after the index date stratified by primary diagnosis (atherosclerosis, cerebrovascular, or cardiac) for atherosclerosis patients and comparison cohort.