Figures & data
Figure 1. Study design scheme.
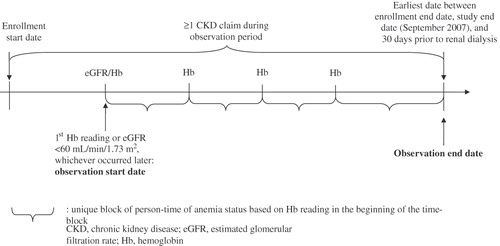
Figure 2. Patients’ disposition. *Defined as ≥1 CKD claim + ≥1 eGFR <60 mL/min/1.73 m2 + ≥2 Hb readings; †Categories not mutually exclusive. CKD, chronic kidney disease; eGFR, estimated glomerular filtration rate; Hb, hemoglobin.
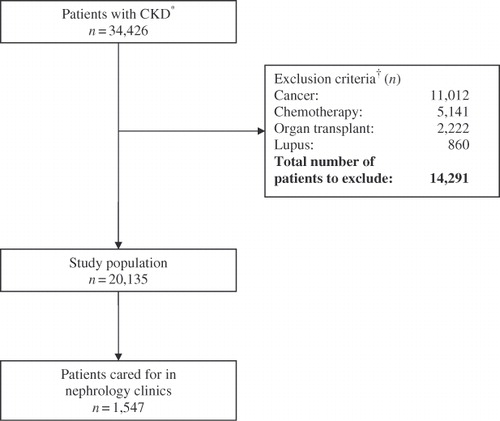
Table 1. Study population characteristics.
Table 2. Unadjusted and adjusted healthcare cost difference between CKD patients cared for in nephrology clinics and other care settings: all patients.
Table 3. Unadjusted and adjusted healthcare cost difference between CKD patients cared for in nephrology clinics and other care settings by CKD stage at baseline.
Table 4. Unadjusted and Adjusted Healthcare Cost Difference between CKD Patients Cared for in Nephrology Clinics and Other Care Settings by Anemia Status.