Figures & data
Figure 1. Structure of Markov microsimulation model of ATV + r compared with LTV/r among antiretroviral therapy–naïve HIV-infected patients. Patients enter model in LPV/r or ATV + r first-line treatment, distributed among the low-viral-load states (2, 4, 6, 8) based on CASTLE trial population. HIV states are defined by CD4 count and mRNA levels, event risks are based on HIV state, lipid levels, and treatment (LPV/r, ATV + r, or second-line), and patients advance to second-line treatment after severe diarrhea, severe hyperbilirubinemia, or treatment failure.
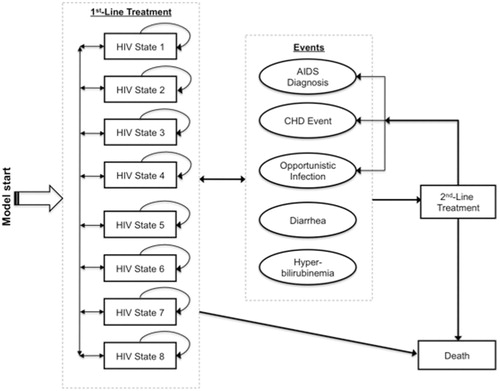
Table 1. HIV states in microsimulation model of LPV/r and ATV + r for management of antiretroviral-naïve HIV-1-infected patients: definitions and transition probabilities*.
Table 2. Model input parameter estimates and data sources for microsimulation of LPV/r and ATV + r for management of antiretroviral-naïve HIV-1-infected patients.
Table 3. Net quality-adjusted life-years lost and costs incurred associated with HIV infection, diarrhea, hyperbilirubinemia, coronary heart disease, and opportunistic infections.
Table 4. Projected health-related, cost, and quality-adjusted life-year outcomes associated with LPV/r compared with ATV + r treatment for antiretroviral therapy--naïve HIV-infected patients: base-case results.
Figure 2. Predicted years spent in first-line treatment (panel a) and incidence (per 1000 person-years) of AIDS diagnoses (panel b), opportunistic infections (panel c), CHD events (panel d), diarrhea (panel e), and hyperbilirubinemia (panel f), by treatment type and year of follow-up.
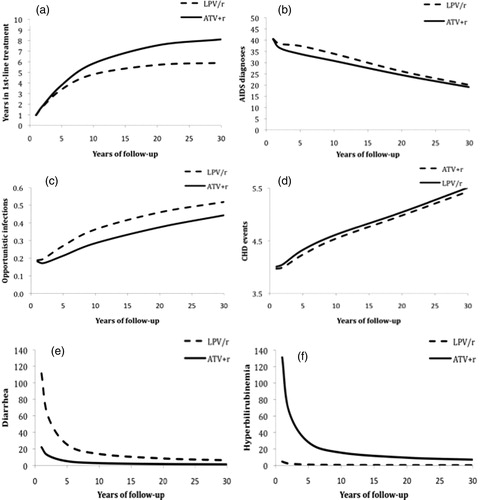
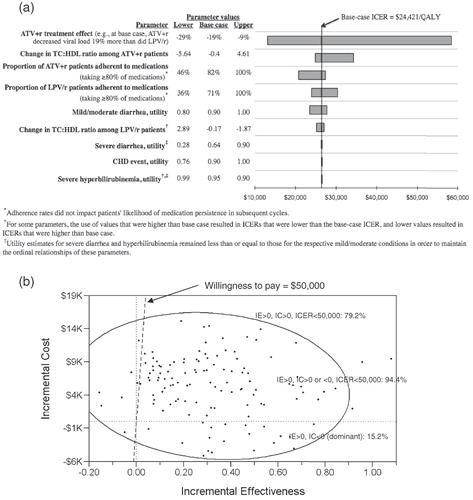
Figure 3. Results of one-way (panel a) and probabilistic (panel b) sensitivity analyses: incremental cost-effectiveness ratios (ICERs) of ATV + r compared with LPV/r with varying estimates of model input parameter values. Tornado diagram results (panel a) are displayed in order of each parameter’s magnitude of effect on the ICER, and lower, base case, and upper values used for each one-way sensitivity analysis are shown. In panel b, each of the 125 points represents one microsimulation analysis of 100,000 individual-level trials; 95% confidence ellipse is shown.