Figures & data
Table 1. Demographic characteristics of the population evaluated in the European osteoarthritis Disease Specific Program (N = 1739).
Table 2. Physician-reported versus patient-reported osteoarthritis severity; 1 = mild, 2 = moderate, 3 = severe (weighted kappa coefficient = 0.61; 95% confidence interval = 0.57–0.64).
Figure 1. Relationship between self-reported osteoarthritis severity and age.
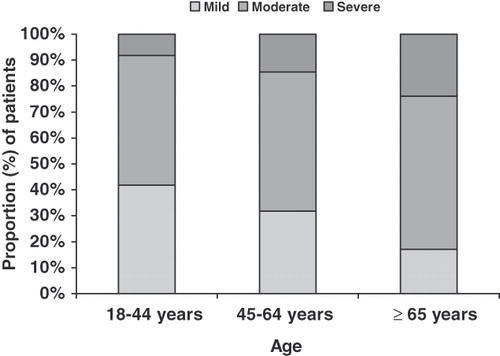
Table 3. Relationship between self-reported osteoarthritis (OA) severity and functional ability to perform activities of daily living.
Figure 2. Relationship between patient-rated osteoarthritis severity and patient-reported productivity. Evaluation of productivity based on the Work Productivity and Activity Impairment (WPAI) questionnaireCitation30. CI, confidence interval. Values of means of percent impairment were adjusted for age, gender and country. *p < 0.05 for pair-wise comparisons between severity levels.
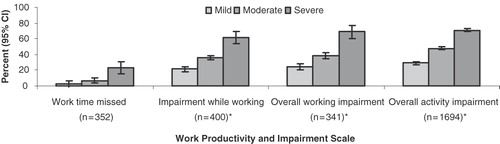
Figure 3. Relationship between patient-reported osteoarthritis (OA) severity and components of the EQ-5D including (A) the five dimensions of the EQ-5D; (B) the EQ-5D current health state thermometer (0–100 visual analogue scale [VAS]; and (C) the EQ-5D index based on the UK value set. Values are means, adjusted for age, gender and country, with 95% confidence intervals. All pair-wise comparisons on OA severity were statistically significant (p < 0.0001).
![Figure 3. Relationship between patient-reported osteoarthritis (OA) severity and components of the EQ-5D including (A) the five dimensions of the EQ-5D; (B) the EQ-5D current health state thermometer (0–100 visual analogue scale [VAS]; and (C) the EQ-5D index based on the UK value set. Values are means, adjusted for age, gender and country, with 95% confidence intervals. All pair-wise comparisons on OA severity were statistically significant (p < 0.0001).](/cms/asset/89973156-cf07-4388-8859-acfe15f6f45d/ijme_a_583703_f0003_b.jpg)
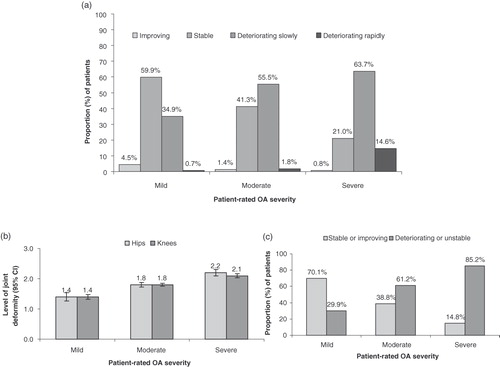
Figure 4. Relationship between patient-reported osteoarthritis (OA) severity and physician-reported clinical parameters of (A) radiologic deterioration in joint space (p < 0.001 for overall association) (B) joint deformity (mean levels; 1 = mild, 2 = moderate, 3 = severe; p < 0.05 for all pair-wise comparisons between severity levels, adjusted for age, gender and country) and (C) disease progression (p < 0.001 for overall association).