Figures & data
Figure 1. Placebo corrected mean effect of ARBs on diastolic blood pressure (reproduced with permission from Zannad et al.Citation7).
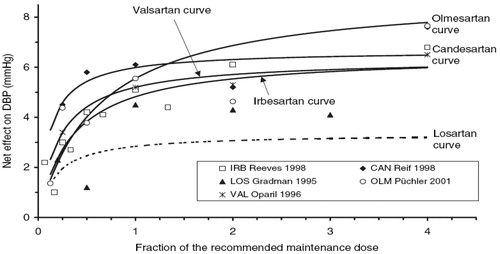
Figure 2. Schematic representation of cost–benefit model.
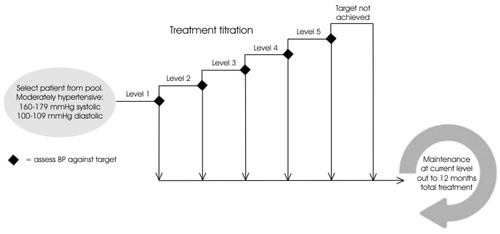
Figure 3. Treatment algorithm. ARB step 1: Olmesartan 10 mg/candesartan 8 mg ARB step 2: Olmesartan 20 mg/candesartan 16 mg ARB step 3: Olmesartan 40 mg/candesartan 32 mg Thiazide step 1: Hydrochlorothiazide 12.5 mg/bendroflumethiazide 2.5 mg Thiazide step 2: Hydrochlorothiazide 25 mg/bendroflumethiazide 5 mg CCB step 1: Amlodipine 5 mg CCB step 2: Amlodipine 10 mg.
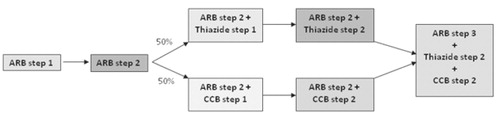
Table 2. Estimates of dose-specific BP lowering efficacyCitation8–10,Citation12.
Figure 4. Numbers of treatments required to reach targets: broken down by ARB and target used.
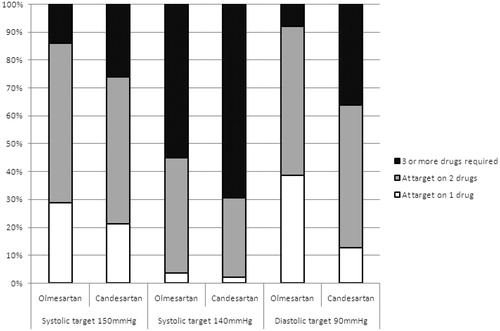
Table 3. Distribution of patients across titration levels.
Table 4. Mean estimated 12-month costs per patient + mean cost per patient to target.
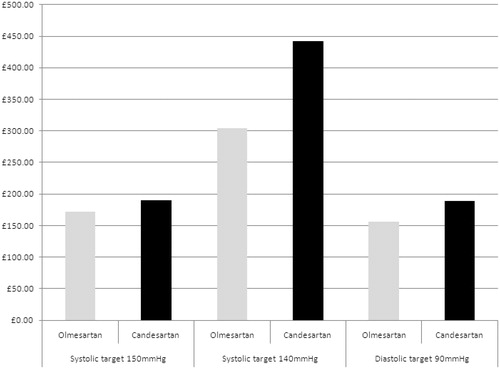
Figure 5. Mean cost per patient to target broken down by ARB and target used.