Figures & data
Figure 1. Disposition of patients included and analyzed.
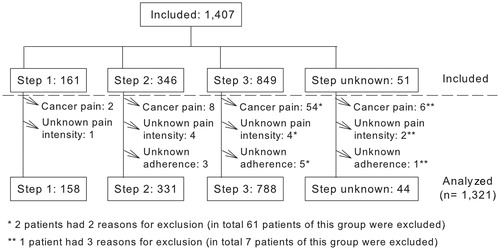
Figure 2. Bubble plot depicting the frequencies of each pain of responses given in the scales about pain intensity and pain medication adherence. The straight line represents the simple linear regression between these two variables. Their relationship was inverse.
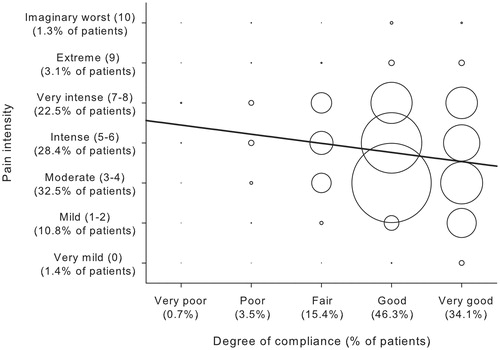
Figure 3. Medications for chronic nonmalignant pain prescribed at least to 3% of the patients comprising the study sample, coded at the fourth level of the WHO’s ATC classification system. The results from patients whose pain medications could not be staged (n = 44) were omitted for simplicity. WHO = World Health Organization; ATC = Anatomic Therapeutic Chemical.
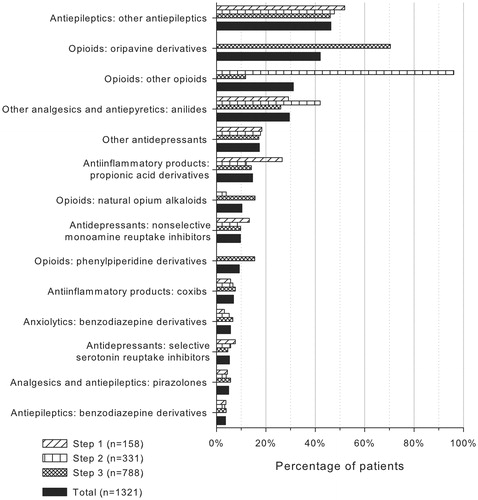
Table 1. Patient characteristics by study groups (WHO's pain ladder).
Figure 4. Propensity scores (probabilities) of each pain intensity level calculated for each adherence level after adjusting by potential confounding variables. The pain intensity level with the highest probability is that predicted for each adherence level (for example, patients with ‘good’ adherence – white bars – are expected to have moderate pain, whilst patients with ‘very poor adherence’ – black bars – are expected to have very intense pain).
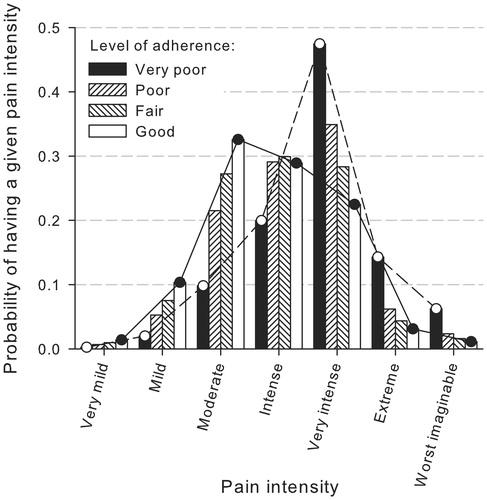
Table 2. Multiple linear regression between pain intensity and patient adherence to pain medications and other variables.