Figures & data
Figure 1. Structure of pregabalin versus usual care stochastic simulation model.
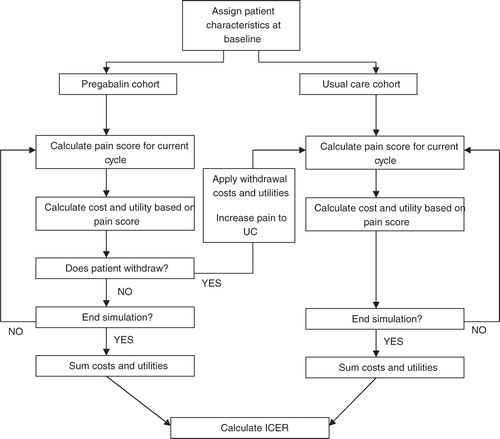
Table 1. Details of clinical studies describing the effectiveness of pregabalin in the management of NeP.
Table 2. Pain scores and patient numbers of the four studies providing clinical data input to the model.
Figure 2. Clinical data input: pregabalin and usual care pain profiles.
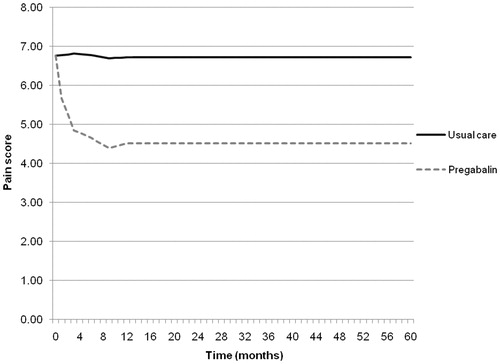
Table 3. Adverse event and withdrawal profile of the treatment cohort.
Figure 3. Utility data from the new pain survey by pain score.
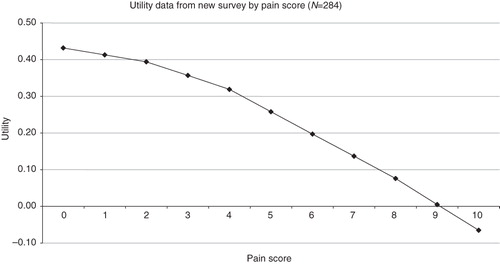
Table 4. Quantities and costs of treatment and treatment-related resources (weekly cost and quantities) in refractory patients.
Table 5. Pricing of other pain medication usage.
Figure 4. Simulated pain profiles of the treatment and comparator cohort over the model time horizon.
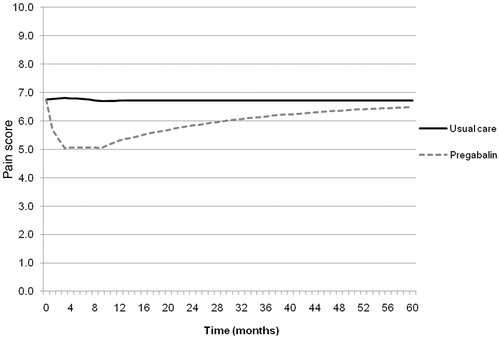
Table 6. Cost-effectiveness results (base case analysis).
Table 7. Cost-effectiveness results (deterministic sensitivity analyses).