Figures & data
Table 1. Analysis overview.
Table 2. Epidemiology and demographic profiles.
Table 3. Cancer incidence ratios*.
Figure 1. Mean total management costs of patients treated with ESAs.
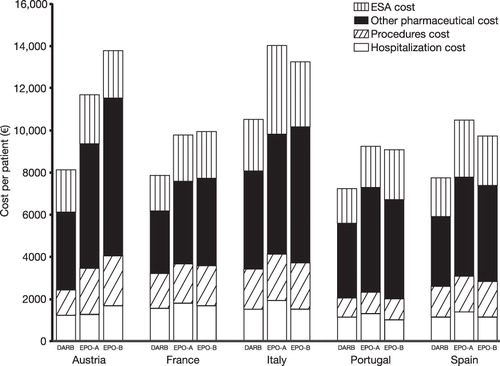
Table 4. Mean (SE) total costs and anemia-related costs (including ESAs).
Table 5. Comparison of total management costs and anemia-related costs between DARB and EPO-A or EPO-B per country.
Table 6. Impact of country-specific adjustments on cost drivers.