Figures & data
Figure 1. Schematic description of Markov model.
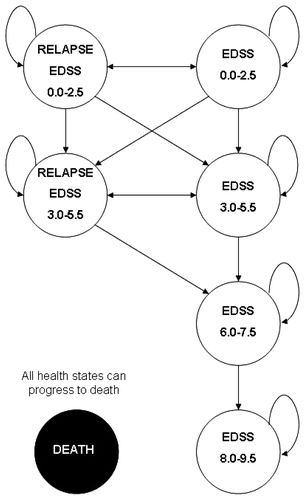
Table 1. Summary of model inputs.
Figure 2. Relapse rate estimation.
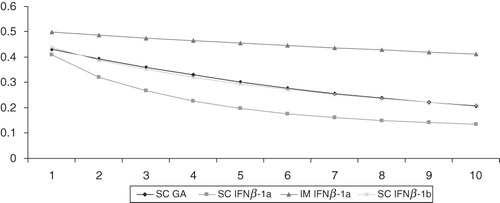
Figure 3. Disease progression estimation for EDSS 0.0–2.5 to EDSS 3.0–5.5.
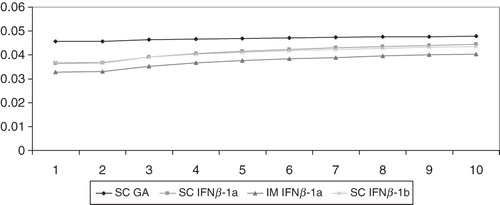
Figure 4. Disease progression estimation for EDSS 3.0–5.5 to EDSS 6.0–7.5.
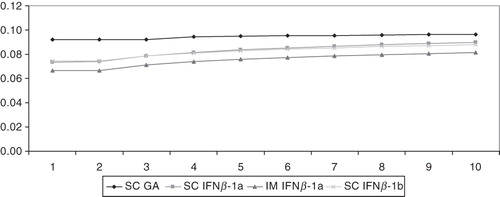
Table 2. Costs (monthly cost, €, 2010).
Table 3. Results.
Table 4. Sensitivity analysis results.