Figures & data
Table 1. Characteristics of the study population.
Figure 1. Time course of LEMS: time from first onset of symptoms to first physician visit, time to explicit diagnosis and time between diagnosis and interview. Patients 7, 10, and 12 had a diagnosis of SCLC.
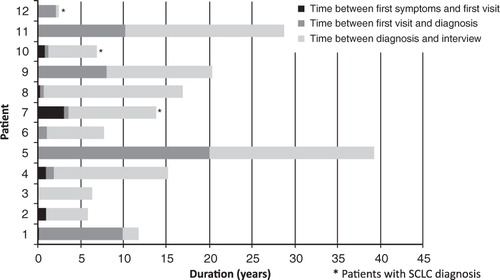
Figure 2. Patient reported symptoms, graded by severity.
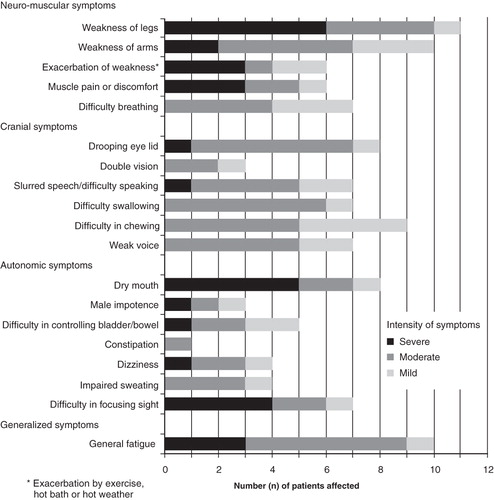
Figure 3. Assessment of physical functioning at the time of the interview.
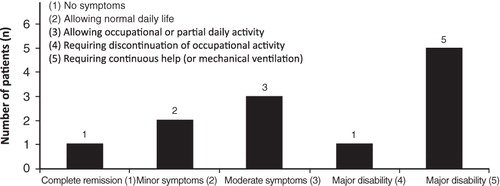
Figure 4. Profile of the EQ-5D scores on the day of interview across domains by patient (1 = no problems, 2 = some problems, 3 = severe problems). Patients 7, 10, and 12 had a diagnosis of SCLC.
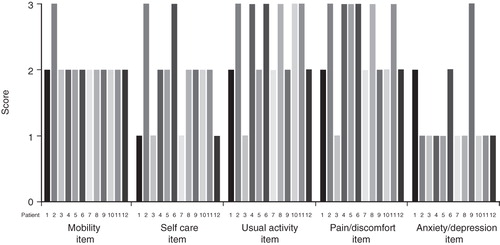
Figure 5. EQ-5D utility scores and symptoms reported.
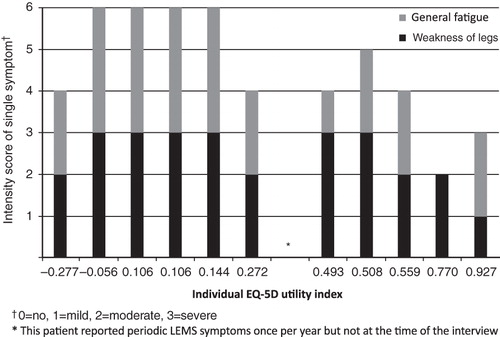
Table 2. Utility index and VAS scores on the day of the interview and the 6-day follow-up period. Patients 7, 10, and 12 had a diagnosis of SCLC.
Table 3. Combinations of drug treatment used in current treatment of LEMS.