Figures & data
Table 1. Variable inputs from audit data collected from St. Georges Hospital, London into the budget impact model questionnaire plus drug acquisition costs without fixed costs.
Table 2. Published efficacy results obtained in controlled clinical trials.
Table 3. Overall cost differences (£) NaPic + MgCit (comparator) – PEG + ASC using the test data (500 colonoscopies per year).
Figure 1. Cost difference (in £) between comparator products and PEG + ASC in colonoscopy costs using test data.
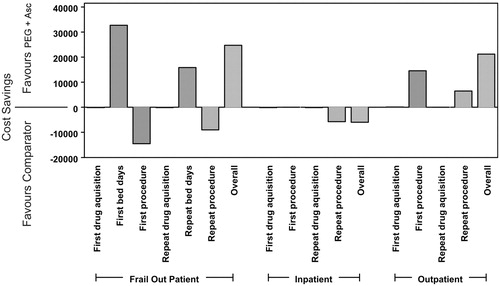
Table 4. Total and per patient cost calculations (£) using either NaPic + MgCit or PEG + ASC for the audit data collected from St. Georges Hospital, London.
Table 5. Detailed total annual colonoscopy costs (£) from St. George’s Hospital, London.
Table 6. Bowel cancer screening costs and revenues (UK).