Figures & data
Figure 1. Simplified Markov model structure. AEs, adverse events; TDF, transdermal fentanyl; TDB, transdermal buprenorphine.
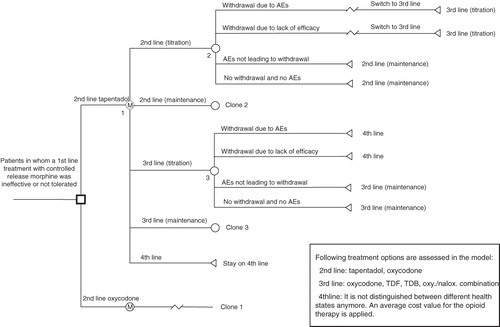
Table 1. Probabilities of withdrawal due to AEs, withdrawal due to lack of efficacy, and AEs not leading to withdrawal for tapentadol and oxycodone.
Table 2. Probabilities of withdrawal due to AEs, withdrawal due to lack of efficacy, and AEs not leading to withdrawal for TDF, TDB, and oxycodone/naloxone combination.
Table 3. Total daily opioid doses applied in the model.
Table 4. Model relevant daily drug costs.
Table 5. Model relevant costs for physician visits and co-medication.
Table 6. Model relevant utility weights for the total population and sub-group.
Table 7. Summary of model relevant utility weights.
Table 8. Model relevant treatment switches.
Table 9. Outcomes (total costs and QALYs), total population, and sub-group.
Figure 2. Cost-effectiveness planes for base-case analysis, total population (a), and sub-group (b). GBP, British pound sterling; QALY, quality adjusted life year.
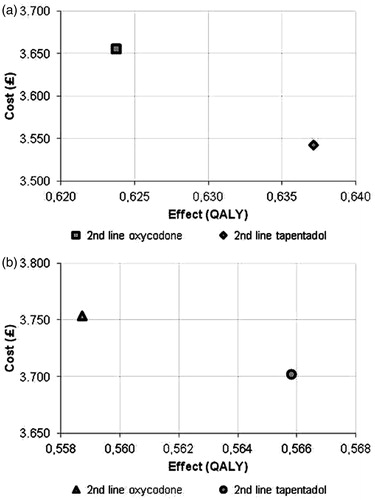
Table 10. Impact on the incremental costs and effectiveness in one-way sensitivity analyses, three most influential variables (2nd line tapentadol vs 2nd line oxycodone).
Figure 3. ICE scatter plots of 2nd line tapentadol vs 2nd line oxycodone; total population (a) and sub-group (b); 5000 simulation runs. QALY, quality-adjusted life year; WTP, willingness to pay.
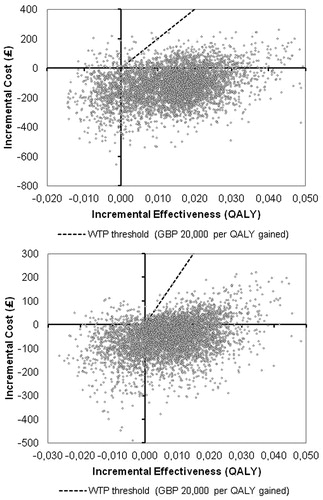
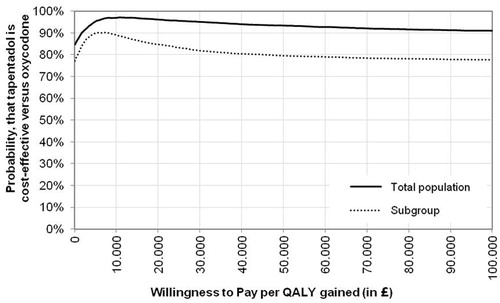
Figure 4. CEACs for 2nd line tapentadol vs 2nd line oxycodone. QALY, quality-adjusted life year; WTP, willingness to pay.