Figures & data
Figure 1. Structure of simple decision tree model. ICU = intensive care unit; RSV = respiratory syncytial virus.
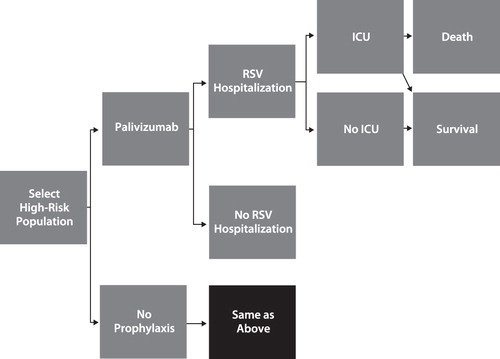
Table 1. Probabilities used in the model by palivizumab prophylaxis and no prophylaxis.
Table 2. Cost of drug administration and RSV-related outcomes adjusted to 2010.
Table 3. Health utilities incorporated in the cost-effectiveness model.
Figure 2. Benchmark of palivizumab cost-effectiveness results with those of vaccines. AAP = American Academy of Pediatrics; DTaP = diptheris, tetanus, and acellular pertussis vaccine; HPV = human papillomavirus vaccine; RF = risk factor; TIV = trivalent inactivated influenza vaccine; wGA = weeks gestational age.
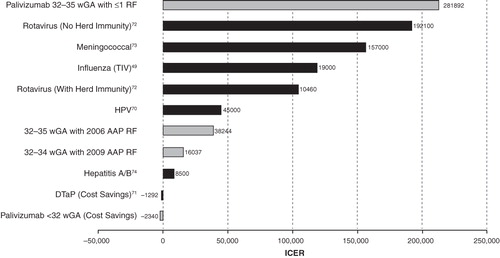
Table 4. Net costs and QALYS between palivizumab prophylaxis and no prophylaxis among the 4 cohorts.
Table 5. One-way sensitivity analysis for infants <32 wGA, ≤6 months CA.
Table 6. One-way for infants 32–34 wGA, ≤3 months CA with 2009 AAP RF.
Table 7. One-way for infants 32–35 wGA, ≤6 months CA with 2006 AAP RF.
Table 8. One-way sensitivity analysis for infants 32–35 wGA, ≤6 months CA with ≤1 RF.
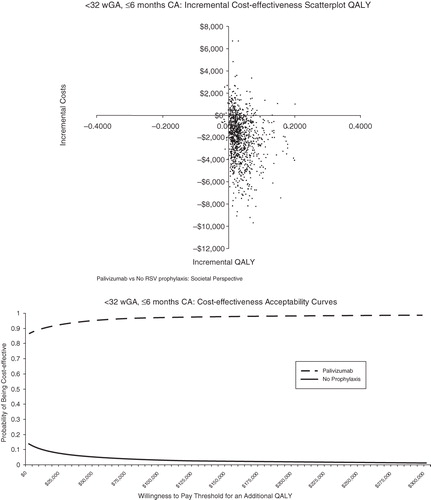
Figures 3 and 4. Probabilistic analyses <32 wGA, ≤6 months CA. CA = chronologic age; QALY = quality-adjusted life-year; wGA = weeks gestational age.
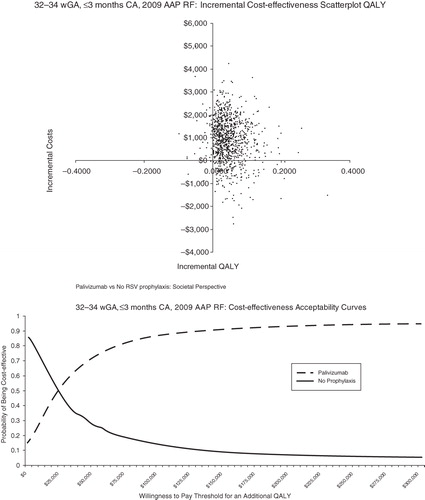
Figures 5 and 6. Probabilistic analyses for 32–34 wGA, ≤3 months CA with AAP 2009 RF. AAP = American Academy of Pediatrics; CA = chronologic age; QALY = quality-adjusted life-year; RF = risk factor; wGA = weeks gestational age.
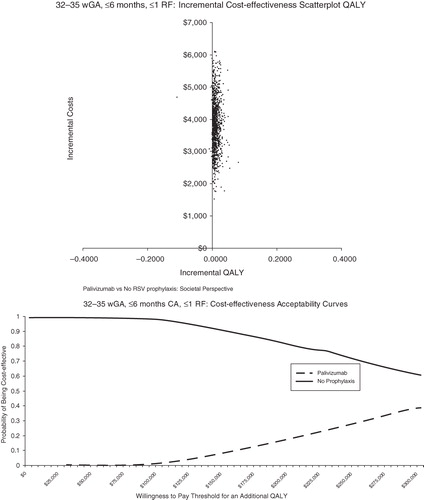
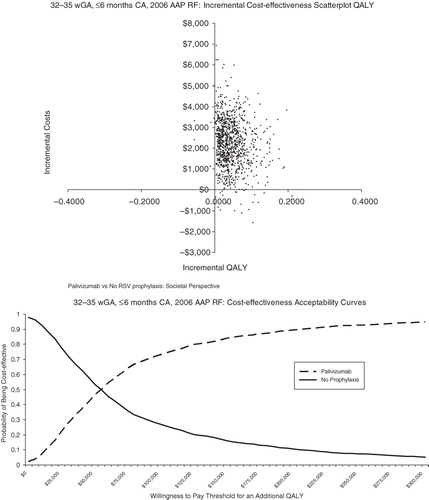
Figures 7 and 8. Probabilistic analyses 32–35 wGA, ≤6 months CA with AAP 2006 RF. AAP = American Academy of Pediatrics; CA = chronologic age; QALY = quality-adjusted life-year; RF = risk factor; wGA = weeks gestational age.
Figures 9 and 10. Probabilistic analyses 32–35 wGA, ≤6 months CA with ≤1 RF. CA = chronologic age; QALY = quality-adjusted life-year; RF = risk factor; wGA = weeks gestational age.