Figures & data
Table 1. Characteristics of the study population.
Table 2. Generalized linear model for direct healthcare cost.
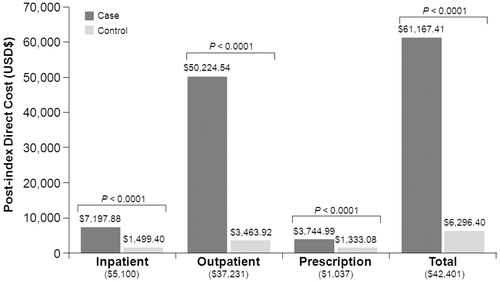
Figure 1. Direct healthcare costs associated with breast cancer. Bar charts indicate the unadjusted results. Numbers in parentheses are incremental difference after controlling for age, geographic region, rural/urban habitat, type of health plan, relationship to worker, natural logarithm of pre-index total direct cost, Charlson comorbidity index, and comorbidity software disease categories.