Figures & data
Figure 1. Depiction of Markov model states. *Not included in the base case scenario. SRE, skeletal-related event; AE, adverse event.
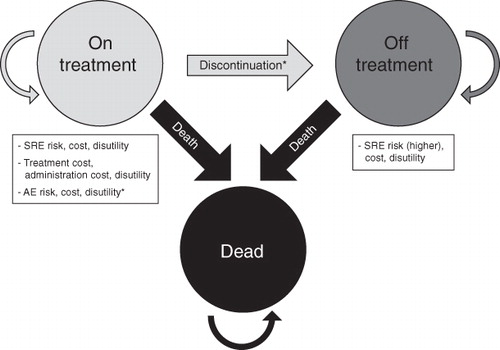
Table 1. Skeletal-related event and drug discontinuation rates included in the model.
Table 2. Baseline utilities and skeletal-related event QALY decrements.
Table 3. Costs of skeletal-related events (2011 USD)Citation9.
Table 4. Real-world skeletal-related event type distributionCitation44,Citation45.
Table 5. Cost-effectiveness of denosumab vs zoledronic acid base case results.
Table 6. Cost-effectiveness of denosumab vs zoledronic acid scenario analyses results.
Figure 2. One-way sensitivity analyses of the effect of the input parameters on cost per QALY gained. SRE, skeletal-related events; IV, intravenous; QALY, quality-adjusted life year; SC, subcutaneous.
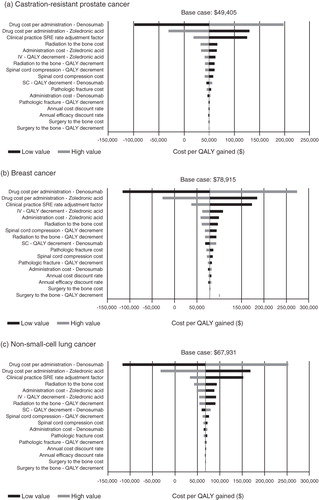
Figure 3. Cost-effectiveness acceptability curves (CEACs) of denosumab vs zoledronic acid in the prevention of skeletal-related events in patients with castration-resistant prostate cancer and bone metastases. The curves illustrate the probability of denosumab being cost-effective relative to zoledronic acid and vice-versa based on different thresholds of willingness to pay. The probability of denosumab being cost-effective relative to zoledronic acid increases as the willingness to pay threshold increases. QALY, quality-adjusted life year.
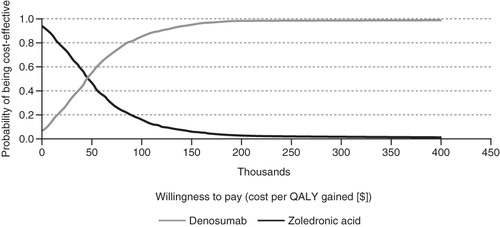
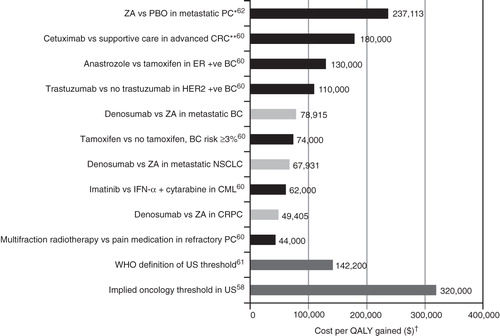
Figure 4. Cost-effectiveness of denosumab vs zoledronic acid relative to other select innovative oncology therapiesCitation58,Citation60–62. *Costs inflated to 2010 using proportional increase in US consumer price index from 2000 to 2010 (http://www.bls.gov/data). **In patients with wild-type KRAS. †Costs in 2010 USD for historical data. ZA, zoledronic acid; PBO, placebo; PC, prostate cancer; CRC, colorectal cancer; ER + ve, estrogen receptor positive; BC, breast cancer; HER2 + ve, HER2-receptor positive; NSCLC, non-small-cell lung cancer; CML, chronic myeloid leukemia; CRPC, castration resistant prostate cancer; WHO, World Health Organization.