Figures & data
Table 1. Cost and resource use (95% CI where necessary)a.
Figure 1. Decision tree.
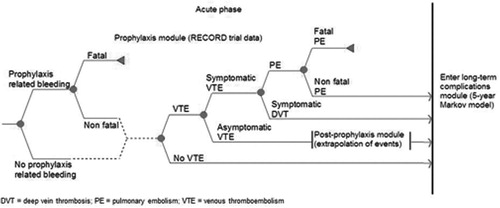
Figure 2. Markov model.
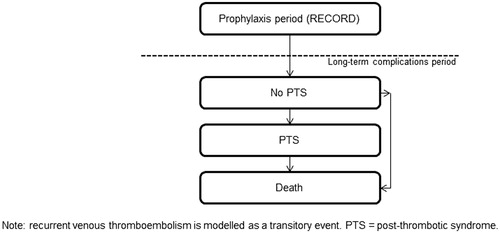
Table 2. Event probabilities used in the model (95% CI)a.
Table 3. Utility values.
Table 4. Costs and cost-effectiveness of rivaroxaban vs enoxaparin following THR.
Table 5. Costs and cost-effectiveness of thromboprophylactic intervention following TKR.
Figure 3. (a) Cost-utility plane for economic evaluation comparing 35 days’ rivaroxaban 10 mg od vs 35 days’ enoxaparin 40 mg od following total hip replacement. (b) Cost-utility plane for economic evaluation comparing 35 days' rivaroxaban 10 mg od vs 14 days' enoxaparin 40 mg od following total hip replacemnt over a 5-year time horizon.
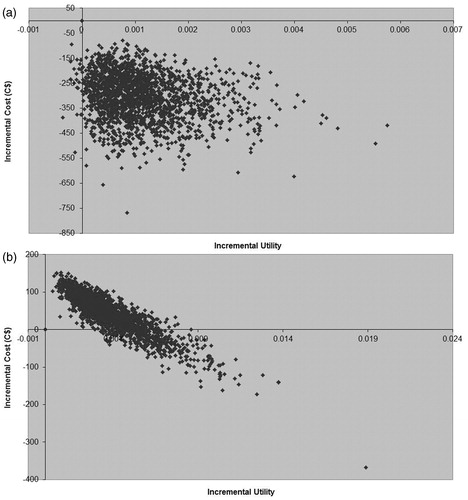
Table 6. One-way sensitivity analysis results: THR.
Table 7. One-way sensitivity analysis results: TKR.
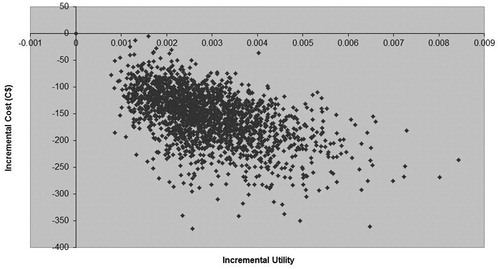
Figure 4. Cost-utility plane for economic evaluation comparing 14 days’ rivaroxaban 10 mg od vs 14 days’ enoxaparin 40 mg od following total knee replacement over a 5-year time horizon.