Figures & data
Figure 1. Markov model structure with health states defined by CD4+ T-cell count, viral load categories, AIDS event, or deathCitation7.
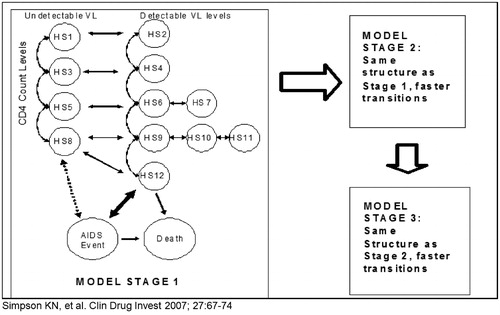
Table 1. Model cohorts at 48 weeks per respective literature results.
Table 2. Health states populating model with their associated QALY weights and corresponding AIDS event costs for the United Kingdom (UK; 2011 totals per quarter).
Table 3. Model drug and treatment switching cost in 2011.
Table 4. ATV+RTV regimen incremental cost-effectiveness ratios and LPV/r regimen savings estimates for the UK, 2011.
Table 5. Sensitivity analysis assumption changes and resulting ICERs.
Viral Suppression, or Death by Health State for ARV-naïve Patients Over a Three Month Model Cycle.
Viral Suppression, or Death by Health State for ARV-Experienced Patients Over a Three Month Model Cycle.