Figures & data
Figure 1. Model health states and transitions.
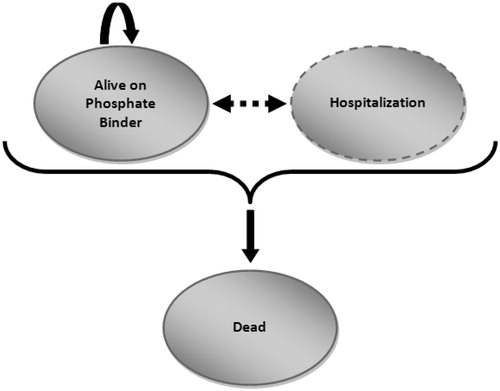
Table 1. Summary of base case analysis inputs, assumptions, and data sources.
Figure 2. Overall survival of patients in the DCOR study (up to 44 months), extrapolated using Weibull regression analysis, shown to 20 years. CBBs, Calcium-based binders.
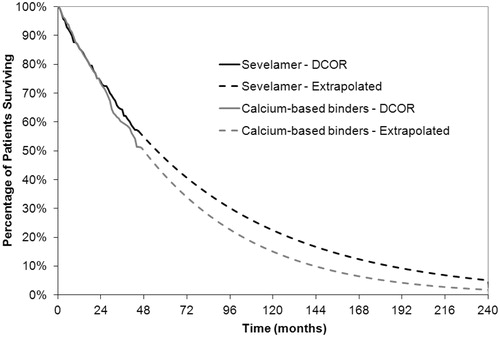
Table 2. Base case cost of a hospitalized day.
Table 3. Summary of the utility studies used to determine the weighted average base case utility value for patients with ESRD receiving dialysis.
Table 4. Discounted base case cost-effectiveness results for sevelamer compared with calcium-based binders, considering a lifetime horizon.
Figure 3. Tornado diagram displaying results of one-way sensitivity analyses. Results are presented as incremental costs per QALY gained (£) for sevelamer vs calcium-based binders.
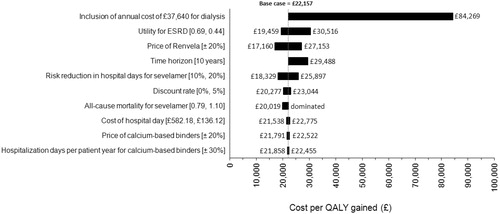
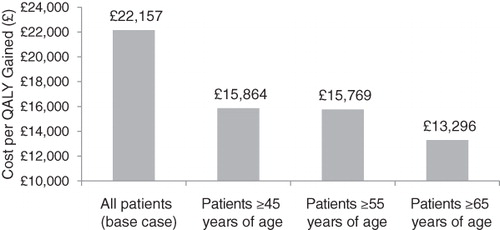
Figure 4. Incremental cost-effectiveness ratios for age sub-group populations of DCOR, including patients aged ≥45, ≥50, ≥55, and ≥65 years.