Figures & data
Table 1. Baseline descriptive characteristics.
Figure 1. Kaplan-Meier graph for treatment persistency between Deferoxamine use and Deferasirox use. †Defined as the drug begun at the index date. Time at risk = 86,336; Log rank test for equality of survivor functions p = 0.004.
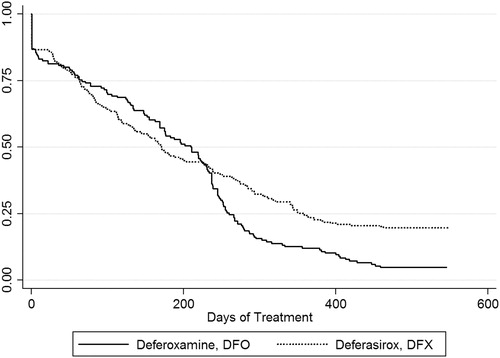
Table 2. Predictors of treatment discontinuation.
Table 3. Baseline and study period per member per month (PMPM) unadjusted average costs according to treatment groups.
Table 4. Predictors of total healthcare costs.