Figures & data
Table 1. Epidemiological parameters and healthcare resources use included in the model (base case value and Min–Max values used for sensitivity analyses).
Figure 1. Data extracted from literature and used in the model for the treatment discontinuation calculations of each treatment over one-year. Time to progression (TTP*) data for trastuzumab-based therapy (TBT) (A) and progression-free survival (PFS**) data for lapatinib in combination with capecitabine (L + C) (B) were respectively extracted from a French observational study (24) and a Dutch Expanded Access Program (26). The median TTP was 8.6 months for TBT (40 months follow-up) and the median PFS for L + C was 4.2 months (15 months follow-up) and are not directly comparable. * TTP was defined as time from treatment initiation to progression or disease-related death; ** PFS was defined as time from treatment initiation until disease progression or death from any cause.
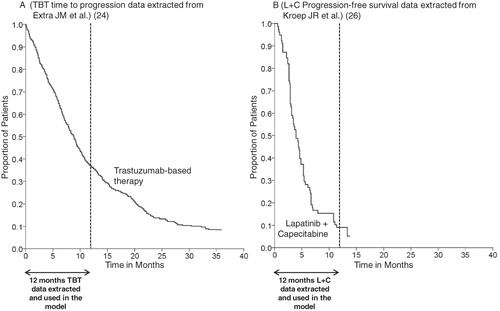
Table 2. Results of the 3-year budget impact for the whole study population in Euros (n = 4182).
Figure 2. Distribution of the cost of treatment per patient and per cycle for trastuzumab-based therapy (TBT) and lapatinib in combination with capecitabine (L + C).
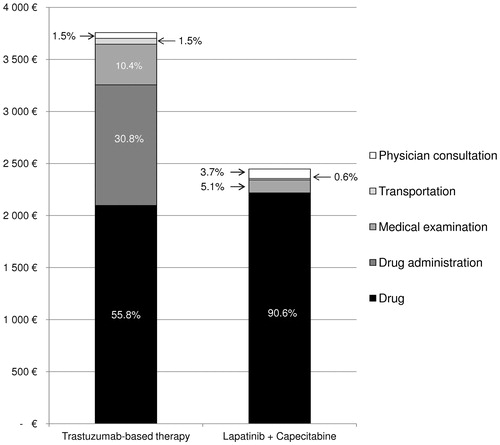
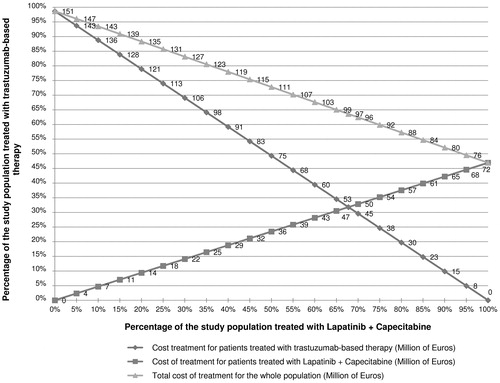
Figure 3. Sensitivity analyses performed on the annual cost for the whole population in each scenario. BSA and weight are dependent variables which were varied simultaneously in the model.
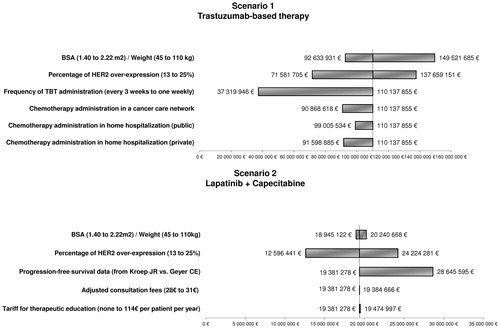
Figure 4. Sensitivity analyses performed on the conversion from trastuzumab-based therapy to lapatinib-based therapy.