Figures & data
Figure 1. Core model structure (right) and treatment algorithm (left) for patients with uncontrolled PEI in the pancreatin MMS treatment arm.
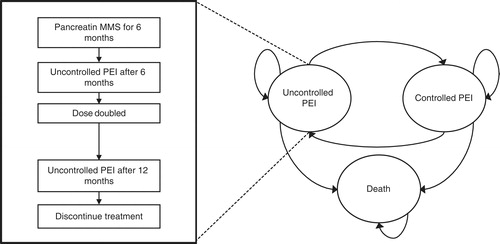
Table 1. Treatment effect from identified clinical trials.
Table 2. Model input parameters.
Table 3. Results for 5-, 10-, and 20-year cost-effectiveness analysis.
Table 4. One-way sensitivity analysis results.
Table 5. Probabilistic sensitivity analysis results.
Table 6. Scenario analysis results based on stool fat excretion below 10 g/day.