Figures & data
Figure 1. Budget impact model structure. Model structure is based on current modeling standards for the budget impact of pharmaceutical products.
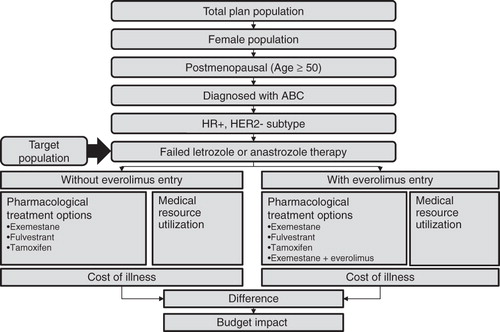
Table 1. Target population inputs.
Table 2. Market share inputs.
Table 3. Pharmacy cost inputs.
Table 4. Medical cost inputs.
Figure 2. Budget impact for the first year of everolimus entry, (a) plan total, and (b) PMPM.
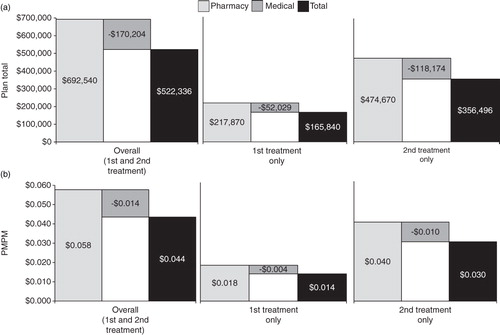
Figure 3. One-way sensitivity analyses. aEverolimus plus exemestane market share: 20% market share as the second treatment option after letrozole or anastrozole failure.
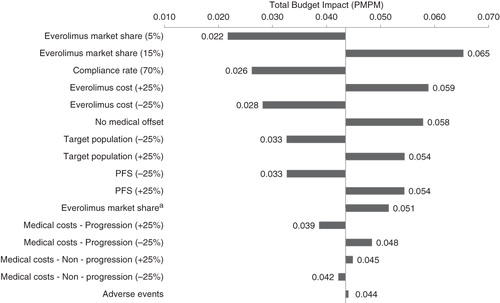
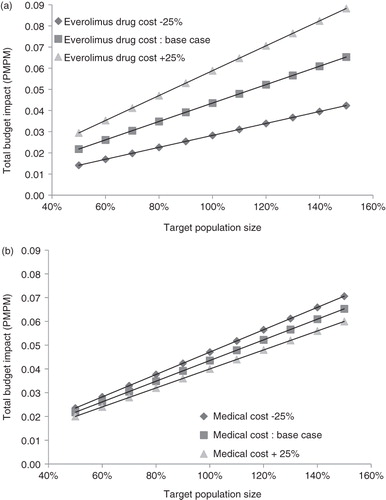
Figure 4. Two-way sensitivity analyses. (a) Target population size and everolimus cost. (b) Target population size and medical cost.