Figures & data
Table 1. Demographic characteristics and comorbidities by refractory status.
Figure 1. Healthcare utilization by refractory status in each calendar year (*p < 0.05).
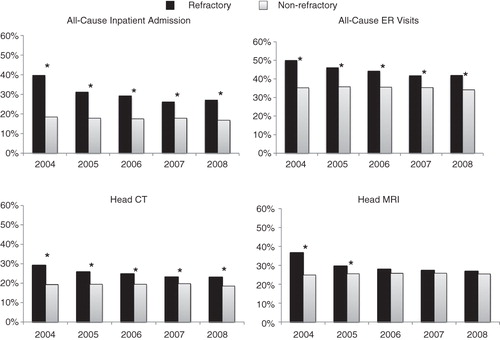
Table 2. Annual all-cause and POS-related healthcare costs per patient by refractory status in each calendar year.
Figure 2. Anti-epileptic drug treatment patterns among patients with refractory epilepsy with partial onset seizures.
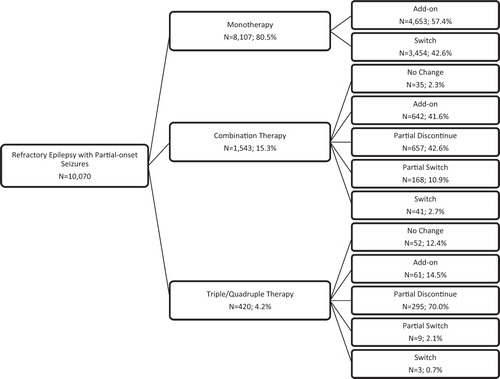
Figure 3. Most common anti-epileptic monotherapies and combination therapies among patients with refractory epilepsy with partial onset seizures.
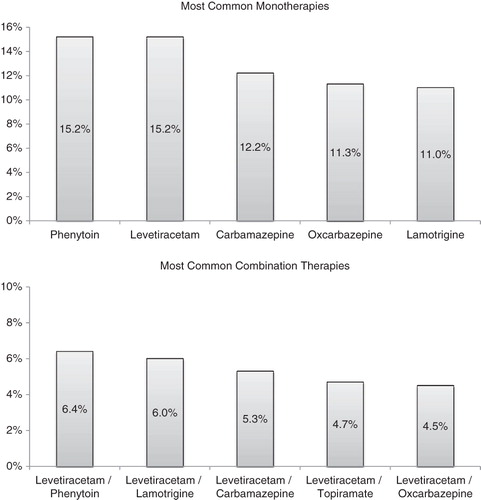
Table 3. Most common therapy add-ons and switches among patients with refractory epilepsy with partial onset seizures.