Figures & data
Figure 1. Selection of subjects with SLE (2003–2008).
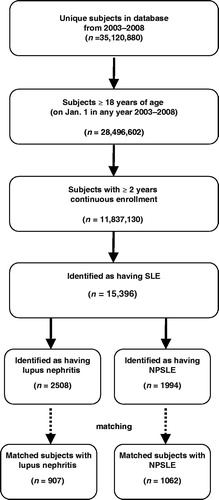
Table 1. Demographic characteristics of lupus nephritis subjects and matched controls (2003–2008).
Figure 2. Average annual component costs of lupus nephritis subjects and matched controls (2003–2008).
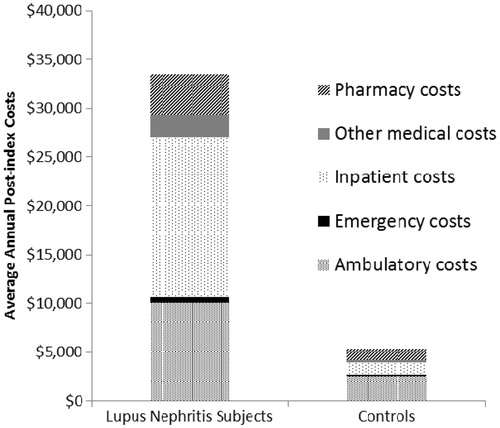
Table 2. Annual (post-index) healthcare resource use of lupus nephritis subjects and matched controls (2003–2008).
Table 3. Demographic characteristics of NPSLE subjects and matched controls (2003–2008).
Figure 3. Average annual component costs of NPSLE subjects and matched controls (2003–2008).
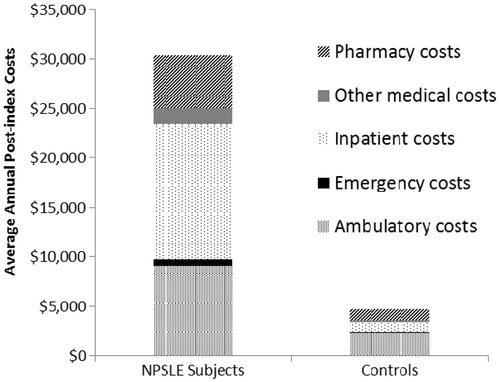
Table 4. Annual (post-index) healthcare resource use of NPSLE subjects and matched controls (2003–2008).
Supplemental material