Figures & data
Table 1. Demographic and clinical characteristics of patients in the pre-index period or at index.
Figure 1. Sample selection flowchart. DAYSUPP, day supplied; ICD-9-CM, The International Classification of Diseases, Ninth Revision, Clinical Modification; METQTY, metric quantity; n, number of patients; U-500R, human regular U-500 insulin; U-100, U-100 insulin regimens.
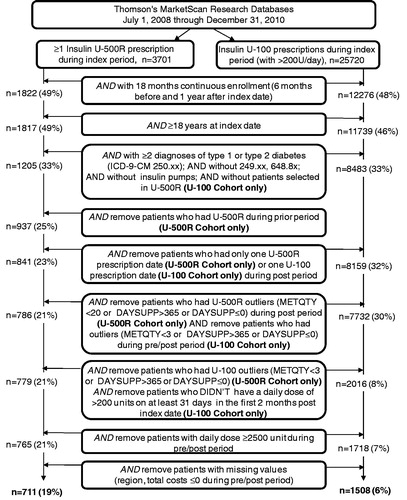
Table 2. Costs for matched cohorts in the pre-index and post-index period.
Table 3. Difference-in-differences cost analyses.
Table 4. Resource utilization.
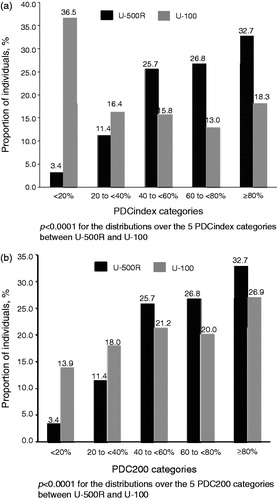
Figure 2. Adherence to index insulin regimens (a) PDCindex (b) PDC200. PDCindex, the proportion of days covered using the index insulin regimen; PDC200, the proportion of days covered using a using a minimum daily dose amount of >200 units; U-500R, regular U-500 insulin; U-100, U-100 insulin regimens.