Figures & data
Figure 1. Distribution of ESAs by frequency of administration.
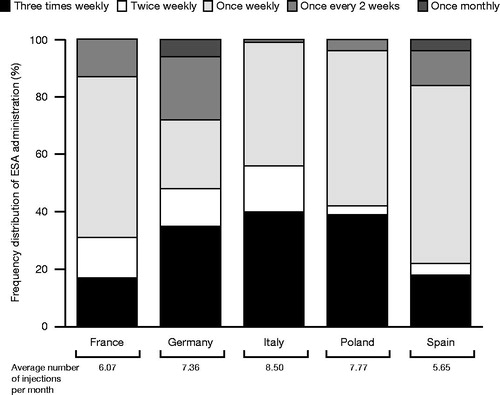
Table 1. Characteristics of ESA administration per country*.
Figure 2. Percentage reduction in time per patient per year (minutes)*.
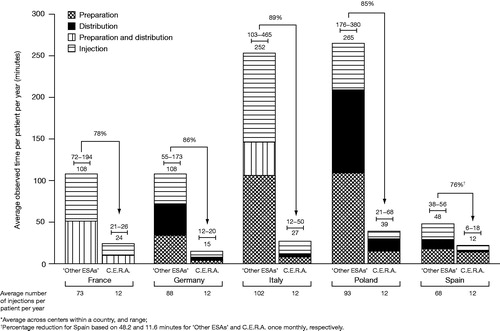
Figure 3. Impact of switching to once-monthly C.E.R.A. from ESAs administered three times weekly or every 2 weeks (scenario analyses).
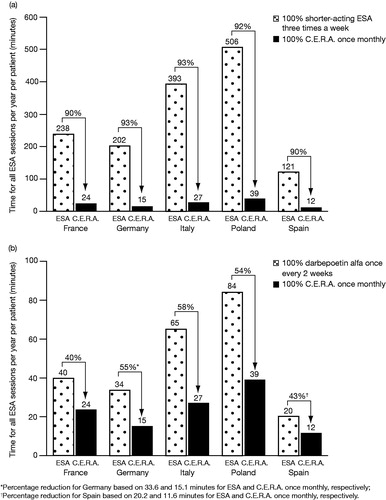
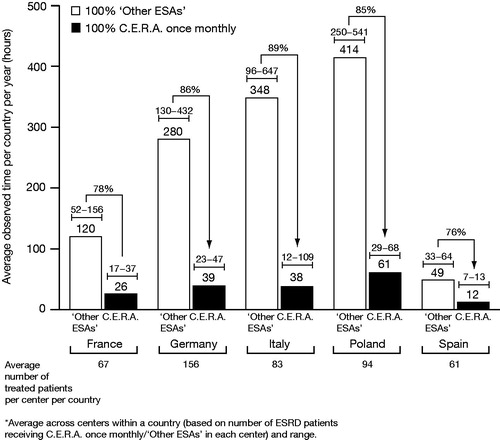
Figure 4. Estimated time savings per center with 100% uptake of C.E.R.A. once monthly by country*.