Figures & data
Figure 1. Drug-level analysis of OAD usage according PI recommendations. OAD, oral anti-diabetic drug; PI, prescribing information.
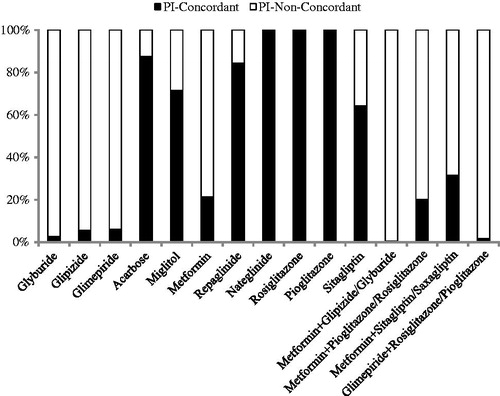
Table 1. Patient demographics, clinical characteristics, and healthcare costs and utilization at baseline evaluation period.
Figure 2. Time to severe hypoglycemic event identified in all settings.
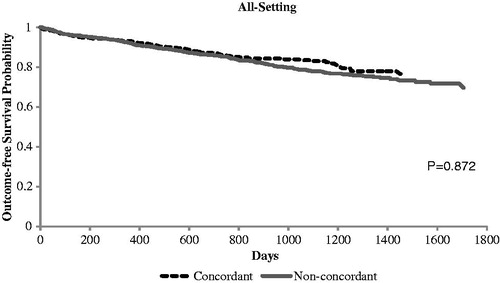
Figure 3. Time to severe hypoglycemic event identified in inpatient setting.
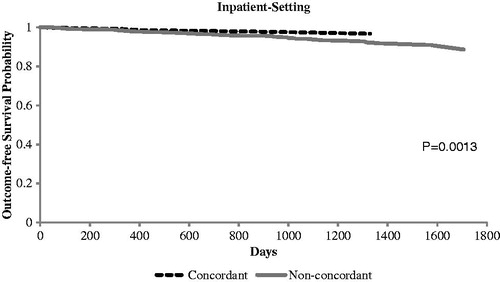
Table 2. Crude healthcare cost and clinical outcomes among PI-concordant and non-PI-concordant stages 3–5 CKD patients during 12-month follow-up period.
Table 3. Regression results for risk of severe hypoglycemic event.
Table 4. Regression results for glycemic control and annual inpatient admissions.
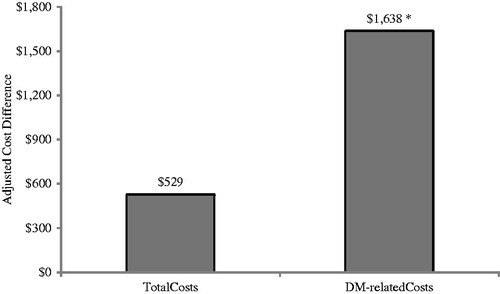
Figure 4. Adjusted 1-year cost differences associated with non-concordance to prescribing information. Model adjusted for age, gender, geographical region, CCI score, CKD stage, visits to specialists, insulin use, and any inpatient hospitalization during the baseline period. *Statistically significant at p < 0.05 compared to PI-concordant cohort.